• Skip to primary navigation
  • Skip to main content
  • Skip to primary sidebar

Sarah Jarvis Team at One South Realty

at One South Realty

  • Search MLS
  • Stats
  • Deals!
  • About Us
    • The Team
    • Testimonial
    • 5 Things I Tell My Clients
  • Calling Policy
  • The Blog
  • Show Search
Hide Search

One South

Assessments, Appraisals and Zestimates

July 5, 2014 By Rick Jarvis

Why is the assessment so high (or low)? Why does Zillow say my house is worth so little (or so much)? Is that the same as my home’s Market Value? And why is the appraisal different from the assessment?

It can be confusing to say the least.

Agents are asked a version of this question with regularity and often, time does not allow us to fully explore the subtleties of the answer.  The summary answer is that each ‘valuation’ is estimating a different value, using differing data and for differing purposes.

Market Value (or Fair Market Value)

iStock_000000808927Small
Wall Street seeks to measure Fair Market Value of almost everything imaginable…

Any discussion of the different valuations begins with the definition of Fair Market Value (FMV).   Fair Market Value is the measurement which most closely reflects the value of the asset at any given point in time.  The simplest definition of FMV is: the price at which both a rational buyer and a seller would exchange the asset neither under undue pressure.

Two key points to remember :

  • FMV is established by the market
  • FMV measures a specific moment in time

Stated differently, FMV is NOT established by a third party at a point in the PAST.  While there may be additional interested parties to the transaction other than the buyer and seller (lender, mortgage insurer, title company, assessor’s office), they are not the ones who set the FMV.  FMV is set by the market and all other valuations SHOULD be driven by this fact.

Alas, it is not always so.  FMV is under attack by the other parties in the transaction and in order to make an informed decision, a buyer or seller needs to understand the intent of each of the other forms of valuation.

Below begins a discussion of the other common valuations and how they are established.

The Assessment (Tax Assessment)

Want to go down to City Hall to protest your assessment?  Here is where...
Want to go down to City Hall to protest your assessment? Here is where you go…

Each year, property owners get a piece of paper from their local City (or Town) Hall asking them to remit payment to the treasurer for their property tax.  We all open the bill with curiosity to see where our ‘assessment’ is and generally, it is met with a grunt, nod or gasp.  Sometimes we feel it is so egregiously incorrect we place a call to the local assessor’s office to argue that the value is either too high (meaning you are paying too much in tax) or too low (meaning that you wish to pay more in tax…not sure I understand why people wish to argue their values UP, but I digress…)  Regardless, the assessment value is what your property tax bill is based on.

Now, how is the assessment established?  Much like Realtors, assessors use a combination of factors including size, age, beds, baths and location, as well as sales price of other ‘similar’ properties…and establish a value.  A city or county does not have to be right, they just have to be ‘close enough.’  In reality, the perfect assessment is one which generates the most revenue without making its residents vehemently complain.  As the actual bill is computed by taking the tax RATE and multiplying it by the tax ASSESSMENT, so a county is better off to lower assessments and up the rate…which they do with regularity.

So how accurate are assessments?  A word that comes to mind is ‘somewhat.’  The assessment uses the least current information (tax assessments are generally adjusted on an annual or bi-annual basis) and it uses the least accurate information.  Since the assessment department does not see the information in MLS and rarely (if ever) visits the home, an assessors office will likely not know if a home has been improved or unfinished areas are completed (think 3rd floor or basement.)  The assessors office will likely not know (or really care) about the condition of a property (unless it is in need of condemnation) or if deferred maintenance has been kept up with and if the grass is cut regularly…despite all of these factors impacting FMV.

Accuracy Level – 85% at best and generally below the FMV, unless the market is falling dramatically.
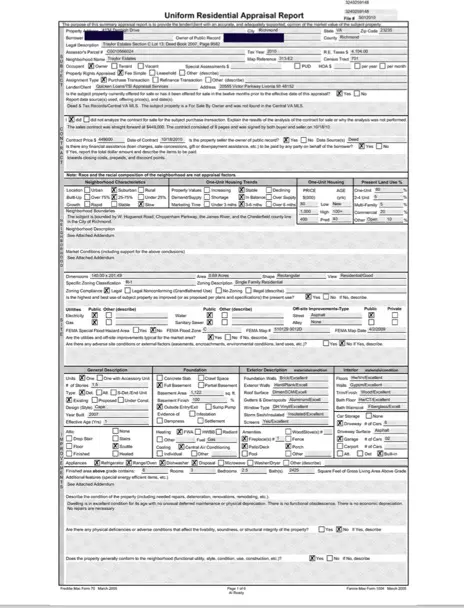
Want to see what an appraisal looks like?

The Appraisal

If you have recently gone through the purchase process and used a mortgage as a part of your purchase, you are familiar with the appraisal.

So what is an Appraisal?  An appraisal is a valuation process required by almost every lending institution when a buyer is using debt (a mortgage or loan) to purchase a home.

It goes like this – a bank contracts a professional appraiser to examine the property and offer an unbiased opinion the value.  An appraiser (generally) has access to the most accurate information (MLS data), the most recent sales and actually visits the property to confirm measurements and condition.  (*** It should be noted that appraisers are licensed and required to attend continuing professional education and many seek additional designations in order to help value more and more complex properties.  In addition, all appraisers use standardized forms to help guide the process ***)

How do appraisers establish values?  While the appraisal process notes the three primary methods of valuation (comparable sales, income approach and replacement cost) the comparable sales method is the most common when establishing value of single family homes.  It is the job of the appraiser to compare the subject property to 3 of the most applicable (and recent) sales in the immediate marketplace and make adjustments for any differences.  Simply put, an appraisal on a 5 bedroom home in Salisbury should be compared to other 5 bedroom homes of similar size and age in Salisbury with small adjustments for differing features (garage size, lot size, new roof, etc.)  The houses being used for comparison purposes should be substantially similar…thus the term ‘COMPARABLE sales.’

What is the purpose of the appraisal?  The appraisal is used by the bank or mortgage company to establish the maximum loan amount.  Typically, the effective interest rate increases (and this is a gross over-simplification) the more debt is applied to the value of the home.  Stated differently (and another incredibly gross over-simplification), a bank might give you an interest rate of 5% if the loan is 80% of the value of the home but closer to 6% if the loan is 90% of the home’s value.  The bank uses the appraisal (and NOT THE SALES PRICE) to establish the ‘loan to value’ ratio for the home.  If the appraisal is less than the sales price, then either (and alert, my last gross over-simplification is coming) the buyer must make a bigger down payment or accept the higher rate.  Needless to say, a great deal hinges on the appraisal, especially when maximum loan amounts are sought, and many deals have failed to consummate due to an appraisal coming in lower than the sales price.

Then how do appraisals differ from FMV?  In many minds (including appraisers, underwriters AND many Realtors) an appraisal and FMV are one and the same…which is unfortunate.  An appraisal is measuring value at a past point of time to establish a value in the present under the assumption past and present market conditions are effectively constant.  Using recent history as an example, the rapidly accelerating (or decelerating) markets of spring 2013 (or summer of 2008), the appraisers were being asked to value properties whose values were literally shifting several percentage points each month and thus, no longer accurate.

And remember, the appraiser did not see what the buyer saw during their home selection process.  A buyer can easily look at 20 homes during their search and select the best option given the available homes at the time.  The appraisal seeks to compare the subject decision to one made during a different time period and by different people who saw an entirely different set of homes.  Far too little attention is paid to this hugely important fact.

Real_Estate_Market_Statistics_for_Zip_Code_Report___RBI
This chart shows median sales price in 23220. Do you think that a sale closed in January can be used to measure the value of a property contracted during May?

Regardless of the arguments presented above, the appraisal is USUALLY accurate enough (in most instances) and while not perfect, is probably the most accurate of the measurements of Fair Market Value.

Accuracy Level – 95-98%

The Zestimate (or other Automated Valuation Models…sometimes called AVM’s)

Zillow buries their accuracy charts deep in their site but they can be found
Zillow buries their accuracy charts deep in their site but they can be found if you know where to look…or by clicking here.

A lot has been written about the issues with Zillow’s estimate of value. They are far from the accurate estimates the market feels they are.

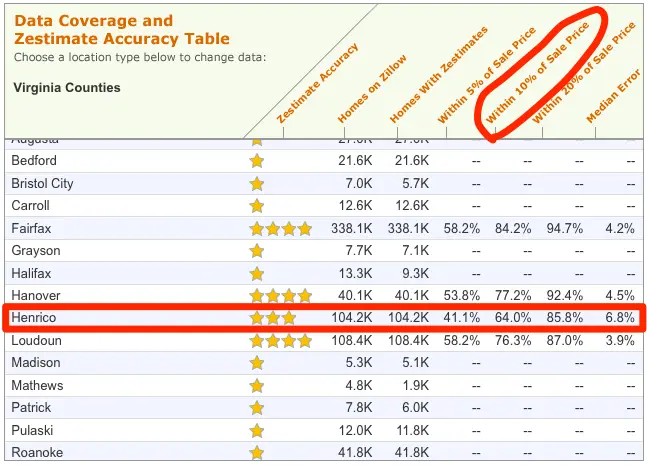
In Henrico County, for example, Zillow offers the following disclaimer – a Zestimate of $400,000 means a computer in Palo Alto has estimated that the ultimate sales price be +10% in 64% of the cases.  The other 36% of the time, the value is less accurate than that.

Use the Zestimate at your own risk.

Accuracy Level – see the chart that Zillow publishes

Summary

If there is any takeaway from this post, it is the measurements of value are all measuring different things for different parties.  Do not mistake any of the varied measurements for FMV.  If you and your agent take the time to do the correct homework and to structure the search correctly, then the correct outcome will occur.  Before you allow a Zestimate or Assessment to cloud your view of  a home you are considering, take a good look at the methods used to establish the valuation and ask yourself who is doing the measuring and how they came to their conclusion.  If you do your own homework and strive to understand the forces that drive the market, your own estimate will be far more valuable than anyone else’s.

Yesterday, Today or Tomorrow…Which Matters Most?

January 24, 2014 By Rick Jarvis

iStock_000026526264Large_jpgAs the snow melts, the flowers begin to bloom and the birds (and bugs) emerge, so do For Sale signs. The spring market is when the large number of homes in our marketplace will transact. Sometimes it is January and sometimes March, but once the weather breaks and summer vacation seems almost reachable, the buyers and sellers emerge and begin their mating dance to see who sells what to whom and for how much.

It will happen again this year.

It happens every year (well, except 2009, but that is a different story.)

So we know houses will change hands…but for how much?  That is the question everyone wants to know.

Valuing Housing

What Realtors are taught about helping sellers establish values has not changed in the several decades I have been in this industry.  We were/are taught to find three recent sales which are similar in size, features age and geography and use some blended average to establish a price.  The sales upon which the value is based are called COMPS (short for ‘COMParable Sales) and can be found by searching in the local MLS or public tax records.

But does it work?

Comping Looks Backwards

What is the flaw in looking at COMPS?

Well, COMPS are past events and what we are trying to predict is a future one.  Additionally, these past sales, even if recent, may still have occurred in radically different market conditions.

See the chart below measuring the rate of sales each month.  Do you notice any trends?

When the rate of sales in April/May is 30-40% higher than October/November, do you think it would be wise to use fall sales to price a spring house?  Probably not.

Likewise, check this out. This chart shows the amount of available housing at any given point during the year.

A buyer will have significantly more choices in October than in April…think it impacts a buyer’s behavior?  You bet.

(For additional market statistics showing Days on Market, Median Prices and Ask/Sale Ratio, visit our page on STATS)

Don’t Ignore Seasonality

While no one knows what the future holds, you can look to repeating patterns in the data to help guide you.  If your best comp is an October sale and you are listing your home in March, be more aggressive.  Also, do not expect to have the results of April if you are bringing you home to the market it September.

The bottom line is pricing is complex and cannot be distilled into a 3 home analysis.  Without looking at timing, you are making an important decision but basing it on incomplete information.

2014 Outlook for Richmond VA Real Estate

January 3, 2014 By Rick Jarvis

2013 was ________ (amazing, as expected, good, bad, awful, medium, depressing, record-breaking, thankfully behind us, the year it got better, other)…I have heard them all.

Depending on who you spoke with, any one of those terms/phrases could have been used to describe the year.  Some home builders had amazing years…others not so much.  Realtors, ditto.  Apartment developers had it great, especially in Downtown Richmond.  Commercial lenders probably did ok.  Mortgage lenders made enough money in the first half of the year to make them think it was 2006 again yet probably thought the last half of the year was more like 2010.

As with almost everything in life, it all depends on your perspective.  But since I am writing this on January 3, 2014, I feel as if I need to offer a prediction.

So what will 2014 bring?  Lets take a look at the factors which may give us an idea.

iStock_000028618614XSmallInterest Rates

January of 2013 began with 30 year money in the mid-3% range.  They stayed there until the spring when they began their gradual climb to their current levels in the mid 4’s.  We enter this January with 30 year money at about 4.5% and more significantly, there was not a huge jump when the Fed announced that they would began to curtail their buydown of rates (think QE 1, 2 and 3).  That is also a good thing as the market is still a bit fragile and shocks don’t go over well.

Most pundits are predicting a relatively flat year with more upwards pressure than downwards pressure. However, these markets are subject to rapid change and with the Fed no longer throwing money at the problem, the artificial tonic keeping rates down is now gone and the market will rule. While there could be an occasional dip in rates, rates above 5% (or maybe even 6%) are soon to be the new normal and the days of 4% 30 year money will be something we tell our grandchildren.

Home Mortgage Rates
View More Interest Rates

It should also be noted that more and more of the leverage in the market (which was no where to be found in 08-12) has returned. Lenders have slowly taken a more aggressive stance towards ‘loan to values’ meaning less equity is required to purchase.

The return of leverage is a key to creation of buyers and more buyers means more pressure on inventory.

Inventory

While the official numbers for December are not in yet, they will be very similar (the chart below will auto-refresh to the most recent data but at the time this piece was written, November inventory numbers were the last update.)  In November of 2012 and November of 2013, the inventory count of available properties (in the Richmond region) was almost even, showing that slightly above 5,000 homes available ‘For Sale.’  While similar to a year earlier, this does not really tell the whole story.  In 2013, the inventory count barely rose as the demand for housing exceeded the previous year’s demand significantly.  For the most part, inventory levels in 2013 were at a multi-decade low and 50% below the peaks of 2009.

If demand is similar or exceeds the levels of last spring, inventory shortages will be even more extreme and the accompanying conditions (short marketing times, multiple offers) will be even more prevalent than in spring of ’13.  These conditions came as a shock to much of the buying public and caused many to miss out on opportunities.

It should be noted that leading edge web traffic counts are currently trending anywhere from 12-18% above this time last year.

Other Indexes

The Dow began ’13 at 13,000…it begins ’14 closer to 16,500.
The NASDAQ began ’13 just over 3,000…it begins ’14 just over 4,000. As a matter of a fact, in 2007, the NASDAQ topped out at just under 3,000…meaning the market is already back above where it was before the crash.

While it is simplistic (and dangerous) to draw too many conclusions about housing demand from stock indexes, it does indicate an expectation by Wall Street that the country’s economy is in a better condition than a year ago.  As confidence increases, people feel more and more comfortable with making commitments.

S_P_Homebuilders_Select_Industry_Index_-_S_P_Dow_Jones_IndicesAnother interesting note is the S and P Homebuilders Select Industry Index change in the past 12 months.

In 2013, it rose by 20%, indicating that Wall Street felt pretty good about owning the stocks of the national home builders. These feelings are primarily due to the historically low inventory levels and the fact that lot production has dropped even more significantly than the production of new homes. Lot production will be one of the next issues the market will have to address as the lead time on a new lot is 12-18 months.

Summary

Overall, the pressures on housing are largely (and strongly) positive with historically low rates and tight inventory.

While the interest rates have risen, compared to historical norms, they are still ridiculously low.  Almost all of the national economic predictions are indicating a 5% increase in house prices.  When you look at the conditions locally, it could be even greater as the supply of housing is restricted by factors that do not exist in many other markets.  Those who wish to enter the market in 2014 need to be cognizant of the fact that selection, especially in mature or fixed areas will be low and any opportunity to purchase a quality home should be taken very seriously.

Citizen 6 New Homes in Richmond VA

December 30, 2013 By Rick Jarvis

I have long held the belief that the best real estate developments are ‘about something.’  The Citizen 6 Project is certainly ‘about something.’

A development can be about location, design, size, views, layouts, schools, neighborhood, proximity, affordability, exclusivity, history or any other number of reasons. The best ones appeal to a specific segment of the market very powerfully and the poor ones do not. Those which hold value the longest are also the ones who appeal to their market in a superlative way.

The Citizen 6 project is a group of six new homes built along Floyd Avenue in the Fan district of Richmond VA. Located along the 2600 block of Floyd, near the Virginia Museum of Fine Arts and Carytown, Citizen 6 offers its owners an amazing combination of attributes sure to make this powerful contributor to Richmond’s real estate landscape for decades.

< Download the Brochure here >

The first thing you notice is the look of the homes. Professionally designed with a decidedly modern aesthetic, the homes of Citizen 6 will be recognizable by all. Richmond’s architecture, especially in our older neighborhoods, is generally traditional period architecture. One of Richmond’s most talented architects was enlisted to ensure that Citizen 6’s striking and sleek exterior envelope will both contrast and compliment the existing housing stock of such an important Richmond neighborhood.

For developers, it is hard to find opportunities to develop in neighborhoods where development is not pioneering. Most redevelopment occurs in areas where redevelopment is needed due to blight or obsolescence. For Citizen 6, this is exactly the opposite. The site was underutilized and replacing a vacant parking lot and small ‘non-period’ office building with 6 new homes was a far higher use of the property. The fact that this site is located a mere 4 blocks from both Carytown and The VMFA, as well as so many other amenities inherent in the Fan means that the new residents will be met with one of Richmond’s most pedestrian-friendly neighborhoods on the day they move in, not years or decades later.

Lastly, the ability to own a new home, with the latest technologies and materials is many’s dream. It is rare to find new construction in a neighborhood whose average home is approximately 100 years old. Citizen 6 offers precisely that – the best in materials and techniques in and amongst the best amenities a century old neighborhood can provide.

While the reasons listed above are important, there are other reasons why Citizen 6 is important. The appeal of the modern design, the open and flowing interiors, the first and floor master suites, off street parking, the potential for Floyd Avenue to become a ‘Bicycle Boulevard’ and the responsible/green building methods are some others.

We are pretty excited to be a part of the project.

Where Are the Cranes?

December 28, 2013 By Rick Jarvis

One of the prettiest views of the Richmond skyline is as you approach the city from the south along 95.

You can see the skyline of Downtown, the James River, Manchester, Shockoe and Church Hill as well as a host of other areas from the I95 Bridge. It gives you a sense of what Richmond is and where it going.

I was returning from an appointment, coming back up 95 from Chester and something a friend said struck me … a few days prior, we were grabbing a bite to eat and talking about a condo he had recently purchased when he made the remark ‘I sure would feel more comfortable about Richmond if I saw a few more cranes.’

My mind had not really had a chance to properly digest that statement.

What Do Cranes Mean?

Counting cranes was not a way of measuring development I had heard before. He was implying that the number of cranes (or lack thereof) was a way of seeing the development activity within a Metro area. The more cranes you see, the more development must be occurring.

New construction in Richmond VA
More cranes = more business? Maybe not in Richmond…

So as I crossed the James River bridge on 95, I decided to count cranes – it did not take long. I could count 2. One was located near the MCV Campus and the other was along the Downtown Expressway near 4th street. I saw no others.

Despite knowing that the development momentum in Downtown Richmond was as strong as it ever had been, the lack of cranes seems to suggest otherwise. Was the development of Richmond lagging behind other Metro areas? Had the market recovery somehow skipped Richmond? Were we about to experience another downturn? Where were the cranes?!?!

Cranes Mean Height

The more I thought, the more I realized that Richmond has never really been a ‘crane town.’  Cranes imply NEW high rise development and the primary path for Richmond is that of RE-development. We RE-develop our buildings in lieu of tearing them down. We adaptively RE-use them and we RE-purpose them. We use the Historic Tax Credit programs to take that which is old and obsolete and bring it back to a new life. We take our warehouses and make them living spaces and turn gas stations into coffee shops. We take car dealerships and convert them into condos and remake call centers into grocery stores.

We are RE-builders as a city and that is a good thing, in my opinion. Redevelopment is greener, more responsible and far more interesting. It is the way we have rebuilt Richmond at a rate far faster than at anytime in our history and will be the reason that Richmond thrives in the coming years – and it does not require cranes.

But We Need to Learn

Richmond VA Warehouse Renovation
The stock of warehouses to renovate is dwindling rapidly in Richmond VA

That said, redevelopment at our current rate will begin to wane as we run out of the supply of historic properties. The rate at which we have repurposed the staggering number of warehouses in our urban core is amazing but will be ending soon as we simply run out of historic building stock.

Warehouse properties which used to be acquired at less than $15/SF are now selling above $40/SF and the number of blighted/abandoned/underutilized properties in Manchester, Shockoe and Scotts Addition are dwindling quickly. Many in the development community have already begun to expand into other cities and towns with historic districts and blighted properties. The tobacco towns of central North Carolina and the smaller towns of SW Virginia as well as the Tidewater area (Suffolk/Norfolk) have seen Richmond’s developers create presences.

While this is understandable, it is also unfortunate in that there is still much to do here.

New Costs More

The next frontier for development in Richmond is not a specific area or neighborhood, it is on the vacant blocks and crumbling surface parking that dot many different places within our city. Currently, incentives strongly encourage developers to redevelop historically and not to build new structures. The cost of ‘building new,’ due to these incentives for renovation of historic properties, is anywhere from 30-50% more expensive when all of the factors are accounted for.

Those who wish to build new structures have a significantly higher cost structure. The rental rates and market values are not high enough to make NEW construction viable in the eyes of lenders. No financing means no cranes.

Its Working, For Now …

So, for now, I am comfortable with only seeing two cranes mostly because I see happy people in places I have not seen them in years. I see more hardhats and dump trucks in neighborhoods where they never used to be and I can’t seem to get to all of the new restaurants that are opening.  I can’t find street parking as easily as I used to and I now see nostalgia overpower fear leading to a reemergence of some of Richmond’s most neglected architectural neighborhoods. The City of Richmond has a positive population trend for the first time in my lifetime and I think that is not just a good thing, but a great one.

Richmond in 2020 and beyond will need cranes and I just hope that those with the power to make a difference understand how they can help us transition to a bigger, better and more balanced Richmond as we move forward.

  • « Go to Previous Page
  • Go to page 1
  • Interim pages omitted …
  • Go to page 7
  • Go to page 8
  • Go to page 9
  • Go to page 10
  • Go to page 11
  • Go to page 12
  • Go to Next Page »

Primary Sidebar

804.201.9683


How Do I Schedule a Showing or Find Out More?

I am Kendall C. Kendall, Client Care Coordinator for the team. I am a licensed Realtor and it is my job to answer questions and schedule showings for the properties shown on our sites. Here's our call policy.

kendall@richmondrelocation.net

Working With Buyers

I am Sarah Jarvis, Broker at One South and I work with our buyers. I bring 20+ years of experience to our Buyers Advocacy program and take great pride in helping our clients understand the RVA marketplace.

sarah@richmondrelocation.net

From the Blog

Dollar Per Foot, a Critique

‘How much a foot?’ ‘What is the per foot on that home?’ 'Feels like a lot per foot!' 'Dollar per Foot' is probably the most used of the comparative statistics in the valuation of housing today. Every buyer references it at some point during the home buying process -- as do most sellers. And so …

[Read More...] about Dollar Per Foot, a Critique

More Posts from this Category

  • Facebook
  • Instagram
  • LinkedIn
  • Twitter

The Ultimate Stats Page

Ultimate Stats Page

Latest Tweets

  • Just now

Footer 1

Test Text

804.201.9683


How Do I Schedule a Showing?

I am Kendall C. Kendall, Client Care Coordinator for the team. I am a licensed Realtor and it is my job to answer questions and schedule showings for the properties shown on our sites. Here's our call policy.
kendall@richmondrelocation.net

804.305.2344


How Do I Determine What I Can Afford?

We offer competitive mortgage solutions with a commitment to exceed your expectations. We’re local industry experts who are also your friends and neighbors. Whether you want to communicate online or in person, we’re just a call or click away.
www.cfmortgagecorp.com
C&F Logo

Equal Housing

The Sarah Jarvis Team agrees to provide equal professional service without regard to the race, color, religion, sex, handicap, familial status, national origin or sexual orientation of any prospective client, customer, or of the residents of any community. Any request from a home seller, landlord, or buyer to act in a discriminatory manner will not be fulfilled.

IDX Disclaimer

All of the information displayed here is deemed to be gathered from reliable sources but no warranties, either express of implied, are made part of this site. Additionally, the IDX Feed for listing information may contain descriptions of properties not represented by One South Realty, its agents or staff and any violations or misrepresentations are the sole responsibility of the listing brokerage of the subject property in violation.

Contact The Sarah Jarvis Team

804.201.9683

One South Square Logo

2314 West Main Street Richmond, VA 23220

sarah@richmondrelocation.net

Our Call Policy

Accessibility
Copyright

Lending

Southern Trust Mortgage Logo

Chris Lester
Senior Loan Administrator
NMLS# 353830
804-307-7033
Email Southern Trust Mortgage

Our Network of Sites: RichmondVaNewHomes.net, RichmondVaCondos.net, RichmondLuxuryNeighborhoods.com,
RichmondFanRealEstate.net, RichmondVaMLSSearch.net
Housekeeping: Sitemap, Listings Sitemap


Members of the Sarah Jarvis team are licensed in the Commonwealth of Virginia.


Loading Comments...