• Skip to primary navigation
  • Skip to main content
  • Skip to primary sidebar

Sarah Jarvis Team at One South Realty

at One South Realty

  • Search MLS
  • Stats
  • Deals!
  • About Us
    • The Team
    • Testimonial
    • 5 Things I Tell My Clients
  • Calling Policy
  • The Blog
  • Show Search
Hide Search

Blog

What’s Really Happening in Housing

February 28, 2023 By Rick Jarvis


Forgive me, everyone, for I have been a bad blogger and have not written in quite some time.

Despite what many think, we actually have been busy. Besides joining forces with another company to nearly double our size, we have also been navigating an odd market to start this year.

But before you try to turn ‘odd market’ into ‘down market,’ don’t. The market isn’t down.

And that is what this post is about.

But First, an Anniversary

A few days ago, I had a photo in my timeline that showed a screenshot from 2013 that was on one of our sites –– which means the blogs we have been writing go back a DECADE.

I don’t think I realized that we had been filling up this blog for that long, but I noticed it actually went back to 2011!

< Self-high five! >

A Decade Later, It’s Still Inventory

While a decade (ok, 12 years) of blogs and $4 gets you a coffee these days, it does have some value over and above just a bunch of words on some server –– it documents what you were thinking / saying / recommending / telling people through a lot of different markets.

You can see what you got wrong and what you got right, as well as what you thought mattered over the period you wrote. 

This is a long winded way of saying, if you go back and look for a common theme in our blogging, it would be that the single most important predictor of the market is one thing – inventory.

How Do You Calculate Inventory?

Robert Shiller!

As a reminder, when we say inventory, we are referring to how long it would take to sell the houses that are currently on the market, provided no one new listed their home for sale.

Specifically, you calculate inventory in ‘months’ by looking at the number of homes available (ACTIVE) over the number of homes absorbed in the past 30 days (PENDING) and determining the ratio.

1000 homes available and 500 sold in the last 30 days = 2 months of inventory.

Why does it matter? Because it predicts house price appreciation quite accurately:

  • If inventory is less than 6 months, prices rise – and the lower the inventory is, the faster prices rise. 
  • If inventory is more than 10 months, prices fall – and the higher the inventory is, the faster they decline. 
  • Between 6 and 10 months, prices kinda bounce around a bit and don’t really move that much. 

Just so you realize, this isn’t my observation, it is Robert Shiller’s observation, who has a Nobel Prize in economics. I just happen to strongly agree with him.

Where is RVA’s Inventory?

As I write this blog, there is less than 1 month of resale homes on the market, and about 2.5 months of new homes.

Collectively, we have about 1.2 months of total inventory available in the RVA Metro region.
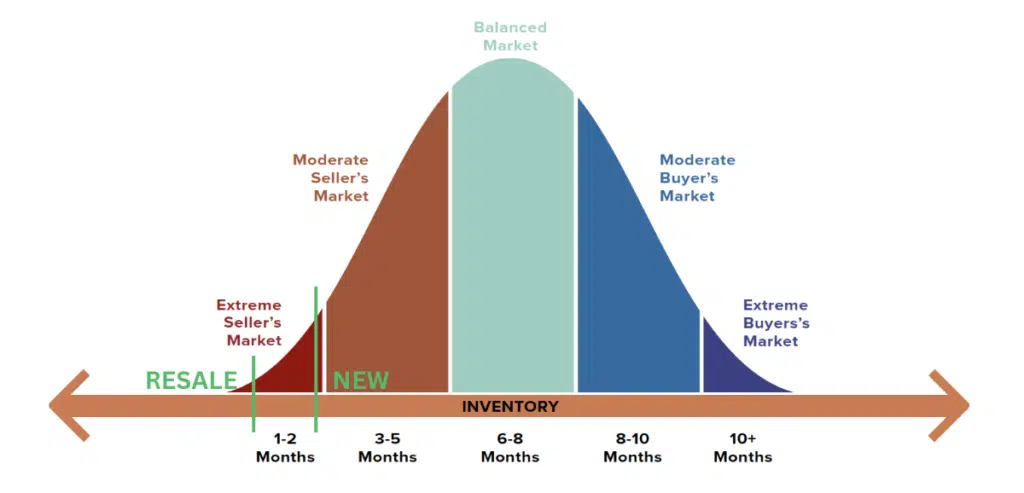
That is looooooow.

When inventory is less than 2 months, look for price appreciation approaching double digits. 

Yes, I just said that. 

Now it doesn’t mean that all price points and all areas will go up by double digits (you need to look to your specific sub-market) but some will for sure. Especially the less expensive and closer in.

But, Rick, What About the Rates?!?

Yeah, what about ‘em? 

I know, they went up. Went up by 2X in less than 6 months ––  an unprecedented and historic increase.

It is a big deal for sure, but not in the way that you think.

This may come as news to some, but rates don’t determine whether or not a buyer qualifies, rates determine how much a buyer qualifies FOR.

It is a subtle –– but critical –– point to understand about the housing market that a lot of so-called experts tend to forget. 

What allows you to qualify for a mortgage? Good credit and stable employment. That’s it. 

Rates impact HOW MUCH you can buy, not IF you can buy. 

The rate is the variable that determines how much house you qualify for.  When rates rise people don’t somehow magically not qualify for a mortgage, they just qualify for a smaller one. 

RVA and Migration

Do you know the median sales price in Richmond? It is roughly $350,000.

Do you know the median sales price in the northeast (from PA to Maine)? $700,000 (and their real estate taxes are 2-3x as well.)

So, if you are a 35 year old, living in Bethesda MD ($1M) or Haddonfield NJ ($600K) or Lorton VA ($580K), what do you do, especially now that you get to work from home? 

You move to a cheaper market.

The South Atlantic region is the big winner in the ‘population migration sweepstakes’ of 2021

Notice a trend?

And what is the first city you reach when you leave DC on 95 that actually has a skyline? 

Richmond.

What is the next one? Jacksonville, FLA (in other words, a lot of farmland between here and there.)

The inbound migration to Richmond is at all time highs – and positive inbound migration provides a lot of tailwinds (i.e. –– pressure on house prices.)

Between our (relatively) cheap housing and proximity to DC (by car) and NY (by plane), along with a very stable economy underpinned by government, education, healthcare, and a shocking number of Fortune 500 companies, we are finally an overnight success after about 50 years. 

And our house prices back that narrative.

Don’t Let the News Fool You

We spend far more time paying attention to bad news than good news, and everyone who is paid by clicks knows that.

And thus the scare tactics. 

Don’t fall for it. 

Our market is fine – and as a matter of fact, little ol’ RVA actually led the nation in appreciation last fall and it is continuing to thrive as other markets adjust (from the article – “Appreciation was still high in Florida, led by Miami with 12.8% growth, and Jacksonville, with 9.3% growth. Other top markets where home prices are still climbing include Hartford, Conn., Richmond, Va., and Orlando, Fla.”)

Summary

The bottom line is that RVA is not the USA. 

What is happening in San Fran, NYC or Vegas is not happening here. Real estate is and will always be a local endeavor, and when you apply a blanket statement to the entire nation, you aren’t going to get it right. 

Yes, maybe some of our upper price points are a bit softer, and new construction still has some adjusting to do, but trust me when I say this, WE ARE MORE THAN FINE.

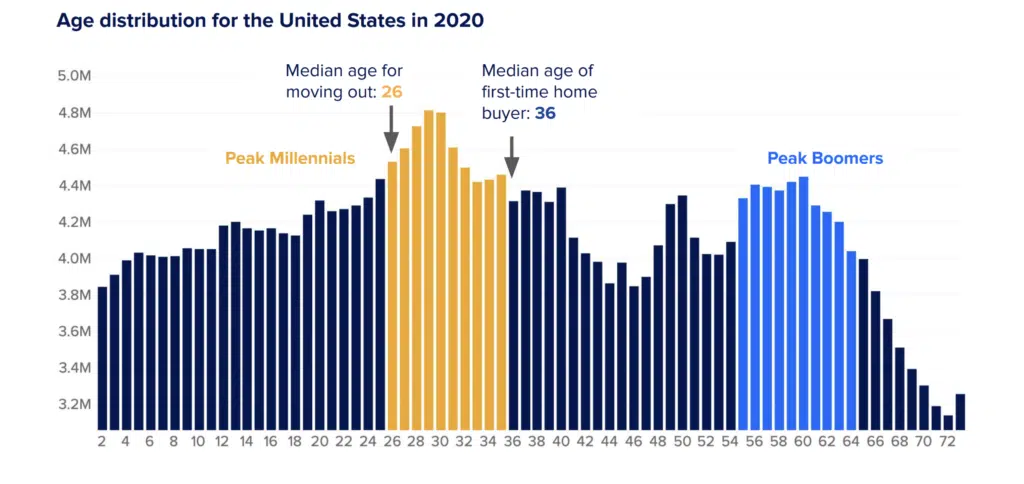
The US population movement to the south and east, when combined with the biggest single generation in the history of our nation (Millennials) hitting their prime home buying age, is benefitting our little community quite nicely – and will continue to do so for quite some time. 

And for what it is worth, we have been saying all of these things for quite some time, too. 

“So while our (affordability) problem feels smaller than their (DC or NY or SF) problem, just remember that their problems used to be a lot smaller, too, until they weren’t. When we ignore the issues, we do so at our own peril and while our affordable housing problem is not our biggest problem — yet — the stage is set for it to not only become far more problematic in the near future, but far harder to cure as well.”

From the Affordable Housing Post, March 2016

Yep. 

Market Report –– September 2022

October 10, 2022 By Rick Jarvis

We have been busy.

Yes, I know, interest rates and stock markets and house prices and inflation –– we hear the same thing. But despite what CNBC would have you believe, we are still quite busy and the market is still active.

Our New Market Report

But in addition to the work we have been doing with clients, we have been developing some new tools, too!

Here you will find the first edition of the One South Market Update, a comprehensive monthly update designed to provide our clients the information we, Realtors, use on a daily basis. Yes, it is a bit more in depth than the typical market report, but we wanted to provide information that is actually useful and not so watered down as to have no real value to the reader. 

This report is modeled after the reports we create for our developers and builders to give them a sense of how each market segment is not only performing relative to other market segments, but how each segment is performing to the market as a whole. 

The bottom line is we wanted to provide insights in our market so that the market behaviors in Austin, Texas or Boise, Idaho aren’t substituted for Church Hill and Midlothian.

Admittedly, there is a lot of information in this report –– so if you would like to have one of the team walk you through the report and how to best interpret it, we would be more than happy to do so!

Sarah, Jenny, Jenny, Molly, and Kendall

The Sarah Jarvis Team at One South Realty

Rates Are Up. So What Happens Next?

August 4, 2022 By Rick Jarvis

In case you hadn’t heard, 30 year mortgage rates rose this year.

After falling below 3% for pretty much the first time ever in 2021, rates began a rather jarring ascent in January and peaked just above 6% in June.

This is not news.

Since June, however, rates have since settled back to somewhere between 5.2% and 5.5%, but the world markets are twitchy, and volatility is still the name of the game –– so stay tuned.

Rates ≠ Demand

As rates have climbed, so has the noise about how rising rates were going to somehow end the bull market in housing.

Sorry, I disagree.

Why? Because the bull market in housing is not about rates –– ok, not exclusively about rates.

Mortgage rates matter for sure, but the long term prospects for housing is currently less about rates, and far more about the systemic and underlying fundamental issues that are not anywhere near being addressed.

Let’s discuss.

What Drives Demand

Ok, so the increase in mortgage rates will decrease demand for housing, right? 

Nah.

Wait, what?!?

‘Higher rates = lower demand’ is a legit argument, yes, but here is the bigger one –– the Millennial Generation is the greatest consumer generation in the history of our country, they are just turning 30, and they are sick of getting pillaged by their landlords.

They want to own housing, just like every generation before them, but there is a total and complete lack of reasonably-priced housing options for them –– and thus the reason that that higher rates will have a minimal impact on demand and pricing.

Boomers and the 1950s Housing Boom

The last time we had a population bulge as pronounced as the Millennials, it began in the 1940s and 50s, due to the GIs returning home from WWII. The conflict-weary veterans wanted to forget about the horrors of war, settle down, get married, buy a home, and start a family.

And start a family they did –– we all know that demographic as the ‘Baby Boomers’ (aka Boomers.)

In order to satisfy the ravenous demand for the new ‘American Dream,’ the US construction industry managed to more than double its output from the previous decade to provide affordable housing options for everyone who wanted one –– it was the biggest increase in home building in our country’s history.

The leading edge of the construction boom began in the 1960’s and didn’t really cool off until the early 2000s.

But look what happened in the period after 2008 –– construction slowed dramatically.

The chart above shows the number of housing starts (new construction) adjusted for the population. In other words, ‘How many new homes were built for each person of population?’ That ratio should remain relatively constant through time in order to keep pace with population growth –– but it doesn’t.

As you can see, the rate of construction in the last decade is at least 50% lower, if not more, than every decade since the 60s.

And that lack of construction is now rearing its ugly head.

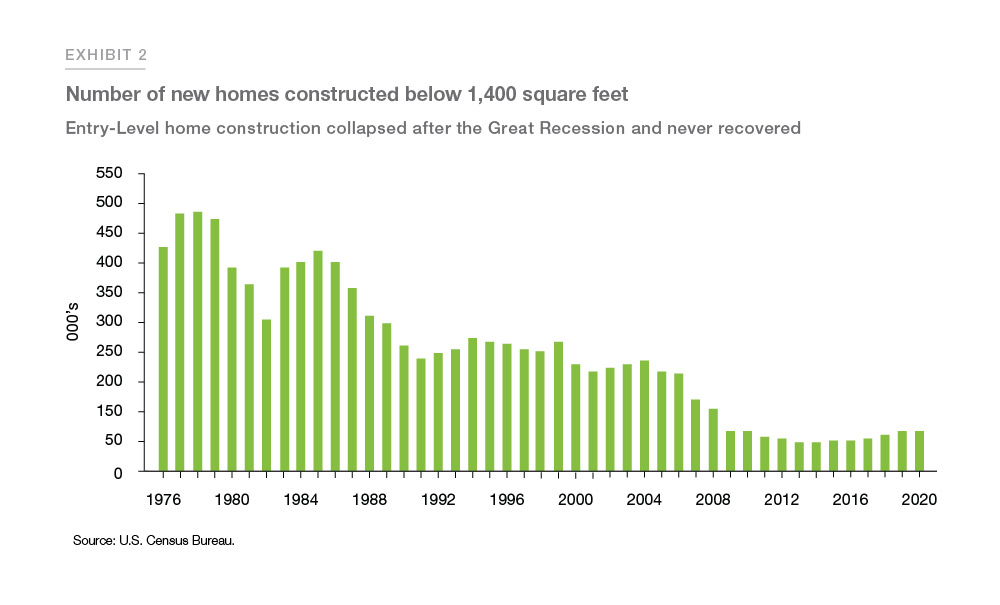
Small Housing is No More

So not only are we building fewer houses, we aren’t building affordable ones either.

Research Chart 2

Anywhere from 35 to 40% of the homes constructed in the 70s and 80s was less than 1,400 SF. Today the number of newly constructed smaller homes is less than 10%.

Our Market

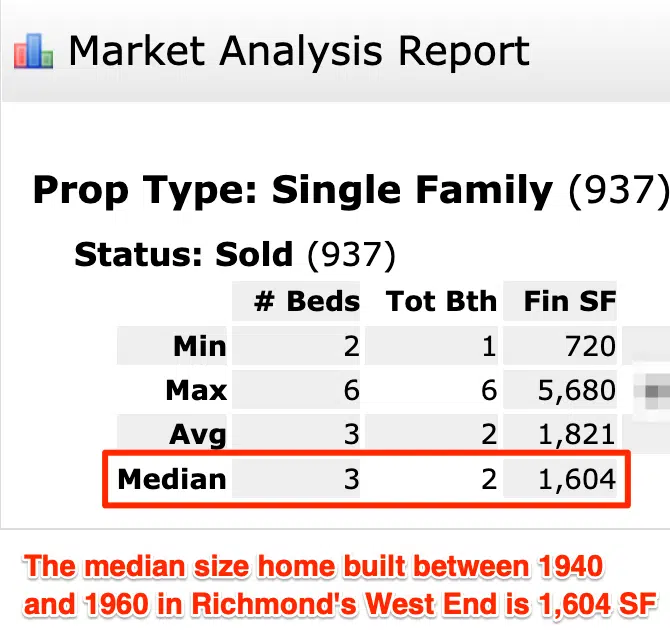
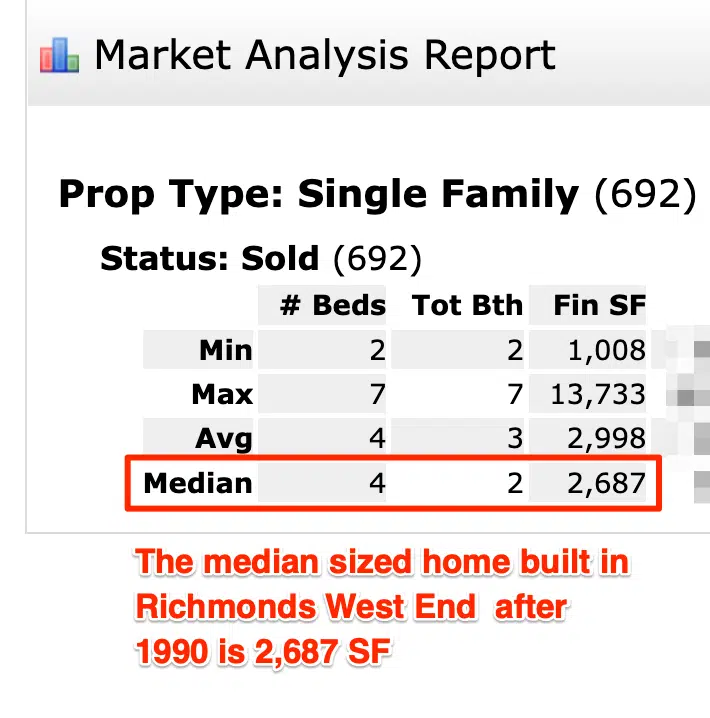
When I look in our MLS, I see the same thing.

A random sample of recent sales for houses built between 1940 and 1960 in Zone 22 (West End / Henrico) shows a median home size of 1,604 SF.

However, when you look at houses built later than 1990 in the same area, the median size jumps … substantially. For a myriad of reasons, the size of the homes we built in the last 30 years increased by over 40%, to 2,687 SF.

Bigger housing, and far less of it –– and we wonder why we have a housing crisis.

The Housing Deficit Isn’t About Mortgage Rates

“But rates are rising. that should take some pressure off the supply, right?”

Ask yourself, did the increase in mortgage rates:

  • Make builders want to build more? Nope, builders have actually slowed down.
  • Make developers want to develop more? Assuredly, no.
  • Make people with 2.5% mortgages want to sell their home and move to another one? Actually, it has had the opposite effect. Owners with low rates are staying put for longer.
  • Make investors want to stop acquiring rental properties? Of course not, investors buy with cash. They love the higher rates. 
  • Make investors want to sell their rental properties? See above. No way.
  • Cause the local Board of Supervisors to suddenly decide to approve affordable housing developments? Nope, voting ‘yes’ to affordable communities is a guarantee to get voted out.
  • Make NIMBYs suddenly have a change of heart about supporting affordable development? Not in the least.
  • Make apartment owners want to lower rent? HAHAHAHAHA! That’s funny.
  • Make all levels of government rethink their housing policies and repeal the layers upon layers of regulation that impede reasonably priced housing getting built? Uhhhh … no.
  • Decrease the cost of building a home? Not one penny. 

Sorry to restate the obvious, but there is nothing about higher mortgage rates that is addressing the undersupply. As a matter of fact, higher rates are actually MAKING IT WORSE.

Why? Because the increase in mortgage rates is slowing down the rate building and development AND it is making it easier for investors to acquire the affordable housing normally reserved for the entry point buyer –– which is the worst of all possible outcomes.

And thus, the idea that somehow mortgage rates in the 5s, 6s, or even 7s is going to magically create more housing at the price at which the median or affordable buyer can secure it is patently false. 

Rates and Qualification

Another important point about mortgages that seems to get lost when rates rise is that rising rates impact what people qualify for, not whether they qualify at all.

In other words, even with higher rates, buyers are still approved for a mortgage, just a far smaller one.

It’s when you change credit score minimums, debt-to-income ratios, job history requirements, and other underwriting rules, than you change the number of potential purchasers.

However, when rates increase, you don’t erase demand, it simply shifts from higher price points to lower ones –– from say $400K down to 300K –– which just increases the pressure on the one segment where the inventory is essentially fixed.

Removing access to subprime loans in 2008 shrank the buyer pool.

Rising rates in 2022 shifted the buyer pool.

it is a key distinction.

And remember, the lower a buyer moves in price, the fewer houses there are to choose from –– and (unfortunately) more cash investors to compete with.

The dreaded double whammy for the entry level buyer.

This Shouldn’t Be a Surprise

People forget that in 2017, 2018, and 2019, the market was already experiencing rapid price increases, bidding wars, and plummeting inventory. All the leading red flags that the market did not have the housing supply to handle Millennial demand were waving wide and high –– and we did nothing about it. 

Remember, mortgage rates hovered around 4.5 to 5% in 2018, and a record number of homes were sold at that time. And I won’t mention the mortgage rates in the 1980s and 1990s and the number of homes sold.

So don’t assume that sales, pricing, and 30 year mortgage rates are perfectly correlated –– because they aren’t.

Do Rates Really Matter?

I know, I know –– I can’t actually be so naive as to believe that when you make a mortgage payment nearly twice as expensive as it used to be, that won’t have an impact?!?

In the interim it might, sure. But I am talking about over the next few years and beyond, not the next few months.

When rates started to jump this spring, many prospective buyers elected to take a ‘home search sabbatical’ largely due to interest-rate-sticker-shock or perhaps delusions that somehow home prices will fall back to 2020 levels.

But my contention is that the ‘wait and see’ approach that many buyers adopted as rates jumped will prove to be futile. The 3% mortgage is now a thing of the past and a 30% price decrease is exceedingly unlikely for all of the reasons stated above –– especially at the median and lower price points, and / or mature areas where the supply of housing is essentially fixed.

No, once the lease renewal comes back with another 10-15% increase, buyers will swallow hard and accept the current rates as the new normal –– and we will be right back to crisis mode. 

2023 and Beyond

I get it, when COVID arrived in early 2020 until today, prices spiked. By most estimates, prices across the board increased +/- 30%, depending on your market and the price point.

A 30% increase in 18 months feels unnatural, and 2008 so ably taught us that just because the housing market hadn’t crashed since the Great Depression, it still could. 

Renting simply isn’t a good idea.

So I get the fear. A lot of people still have scars from the last downturn –– myself included.

But this isn’t 2008.

Will the prices pull back some this fall, or even next spring? Perhaps, but there is conflicting evidence. Some regions have seen more softness than others, while some (like ours) have continued to plow right ahead.

And thus, I encourage everyone to look at the market fundamentals and not simply have a knee jerk reaction to the noise.

I fully acknowledge that a 5.5 to 6% mortgage rate seems high when 12 months ago they were 2.8%, but when your choice is between a $2,500/mo rental payment (rising 15% per year) and a fixed rate 6% mortgage, the answer becomes painfully obvious.

So before we write off the entire market and declare ‘2008, The Sequel!’ just because rates increased to somewhere still shy of historical norms, look at what lies beneath the surface –– a housing availability crisis that is colliding with the biggest population bulge in US history.

The bottom line is that there are more people who want houses than there are houses to go around, especially in the median and lower price –– and that is not only highly unlikely to get better for quite some time, but very likely to get worse.

A Few Notes / Other Thoughts

The New York Times wrote a great op-ed about the housing crisis that I think is 1,000% correct. It requires a free registration in order to be able to read, but totally worth it –– We Need to Keep Building Houses, Even if No One Wants To Buy

After I hit ‘publish’ on this article, the following post showed up in my Twitter feed, it was written in March 2022, so it is a little bit dated, but I would say that either Twitter was spying on me or I am not alone in my opinions –– Home Buyers: Don’t Wait for Prices to Drop in 2022

Finally, a great piece that proposed a counter to the argument that we have a housing undersupply. I am not sure I agree, but the author makes some interesting points –– How Much Housing Do We Need?

It’s (Still) All About Inventory

July 16, 2022 By Rick Jarvis

For those of you who know me, I don’t think the following will come as a surprise to anyone:

  • I follow a lot of bloggers 
  • I read a lot of articles 
  • I listen to a lot of podcasts

The bottom line is that I spend considerable time nearly every day consuming information on all things real estate. 

And in my time researching the market, I have come to one irrefutable conclusion. 

If you only want to follow one metric to understand how your market is doing, follow ‘inventory.’

Inventory is a Calculation

Now, when I say ‘inventory,’ I am using the term in a very specific way. 

Inventory, when used in real estate, refers to a specifically calculated metric that effectively measures the ratio of buyers to sellers.

Why is it so important? Two reasons:

  • Inventory measures the market currently, unlike closed sales which measure the market 45-90 days in arrears
  • Inventory is strongly correlated with price movements and can be used to forecast price appreciation –– but more on that in a moment

Definition

Inventory is defined as follows: it is the ratio of ACTIVE homes for sale relative to the number of homes that have been ABSORBED (gone under contract) in the last 30 days. The measurement is stated in terms of ‘months’ or ‘months of supply’ and answers the following question –– How long would it take us to run out of homes to buy if nothing new hit the market?

Inventory = Availability (Sellers) / Absorption (Buyers)

Example: 1,000 homes for sale / 500 homes pending in the last 30 days = 2 months of inventory. 

Make sense?

Inventory Comprises All

Inventory is the ultimate measure of any market.

Why? Because it combines all market inputs into one simple ratio.

Every input either impacts the number of buyers or the number of sellers:

  • Building costs? That is a seller side input
  • Credit scores? Buyer side
  • Interest rates? Mostly Buyer side … but interest rates can impact how many homes a builder can build, too.
  • Jobs? Buyer side.
  • Lot supply? Seller side.
  • Building codes. Seller side.
  • Rents? Buyer side.
  • School ratings? Buyer side.
  • Commutes? Buyer side.

I could go on and on, but you get the point. 

Any and all factors that impact the market manifest themselves in the inventory calculation by either creating more or fewer buyers or sellers.

Inventory and Appreciation

Robert J. Shiller - Wikipedia
Robert Shiller, Nobel Laureate

Nobel Laureate Economist Robert Shiller (and author Irrational Exuberance), has dedicated much of his work to the study of real estate.

Most real estate pros are familiar with the Case-Shiller Index, which looks at median home prices –– both nationally in the aggregate, and in 20 different metros, individually. The Case-Shiller Index, introduced in the early 90s, is considered the gold standard of home price appreciation measurements.

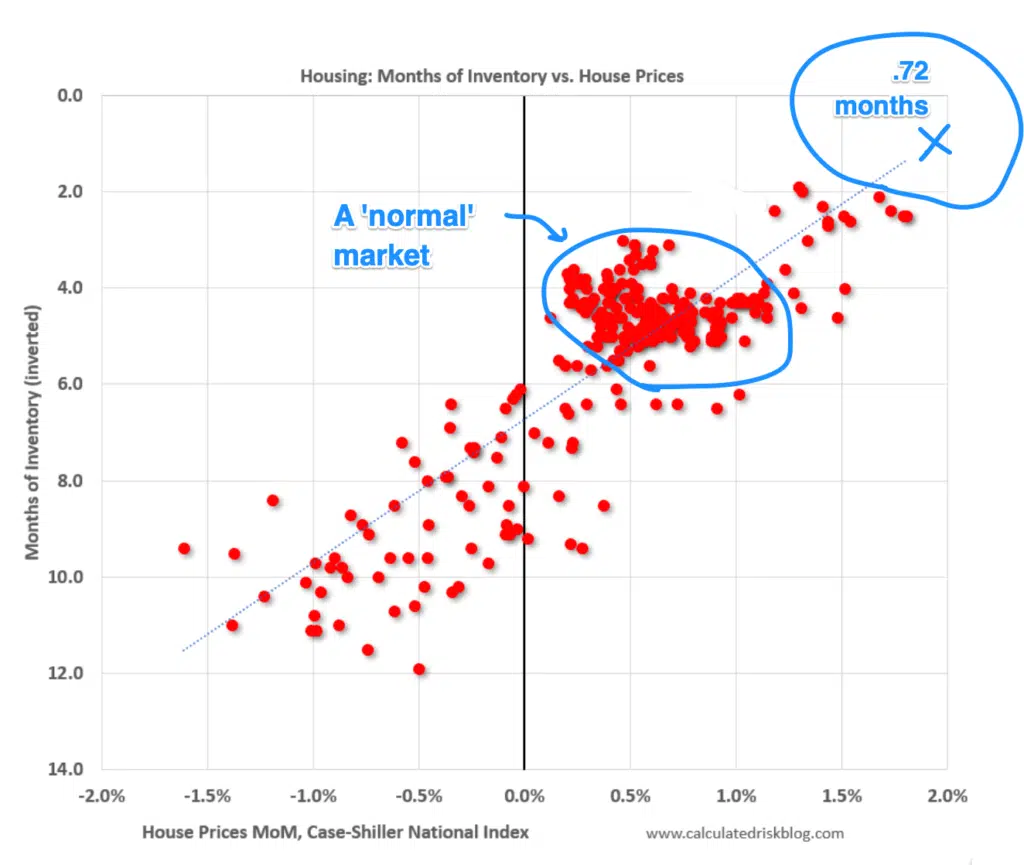
But in addition to the national measurement of home prices, he also created a matrix that plots inventory levels against price appreciation / depreciation.

As you can see, the correlation between the two is rather obvious –– when inventory drops, prices not only rise, but by a somewhat predictable amount. And when inventory rises, price growth slows –– or even falls –– depending on how far inventory rises. 

Show me the inventory count in any market segment and I can tell you an awful lot about how that market is behaving.

Observations

A few observations jump out at me –– which I feel are critical to note as the market is changing:

  1. Housing inventory tends to hover between 3 to 5 months historically (in other words, 3 to 5 months of inventory is what most consider to be a ‘normal’ market) 
  2. Prices flip from rising to falling anywhere between 6 and 10 months
  3. At no time in history have prices fallen with inventory less than 6 months, and even have risen with as many as 8 months of inventory
  4. There are far more instances of rising prices than falling prices

Why are these observations so important to note? Because we are so far from the critical inflection points, despite what the news and other media outlets might have you believe.

So Let’s Look at Our Market

Calculating inventory is not difficult –– if you know what you are doing, it takes about 30 seconds.

Pick a segment (say Zone 22 / Western Henrico between $400K and 600K) and count the active inventory (see screenshot below):

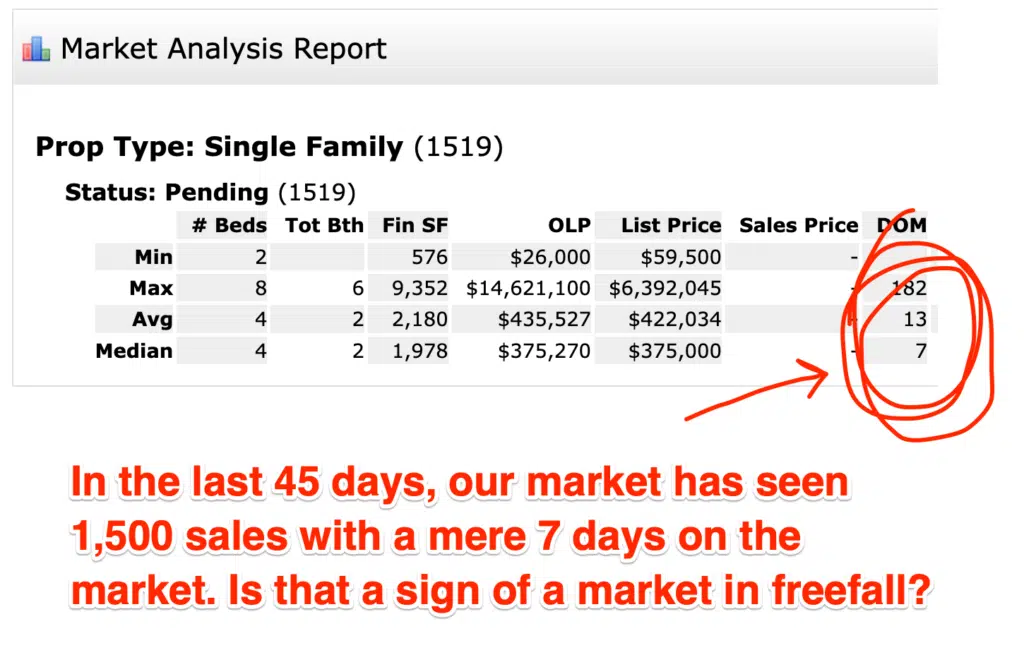
And then count the number of homes that have gone under contract in the past 30 days (see screenshot below):

As you can see, there are currently 26 active listings and 36 homes have gone under contract in the past 30 days (I pulled the info on 7/16/22.)

26 active / 36 pending = .72 months

If you then go to the Shiller matrix, you can see that at .72 months, the expectation of appreciation is still approaching 2% per month (roughly 18 to 24% per annum.)

In other words, still quite robust.

Yeah, But…

I know the counter argument is that as rates rise, the buyer pool will shrink. Yeah, I don’t disagree, but I think the buy side of this ratio is by far and away the less important of the two. 

Right now, we have the following conditions governing our market:

  • Home building is still lagging behind demand for reasons relating to labor availability, material availability, and lot availability. The collective deficit of housing has been growing since 2011 and we are still not building enough houses to keep up with demand, much less chew into the deficit
  • Building costs have increased so quickly that realistically, it is darn near impossible to build a single family home for less than $500K –– and generally it is closer to $600K
  • All of the people who bought and refinanced their home at 2.5 to 3% are now far less likely to move and re-enter the market with a mortgage rate in the upper 5s to 6% –– meaning the excess inventory needed to push down prices will not likely come from the resale side
  • Investors have accumulated a tremendous number of median priced / affordable homes and are similarly unlikely to bring them to market with rents rising at the pace they are
  • The least risky form of construction is to build apartments or other multi-family rentals, and many large homebuilders have already begun to shift their focus to building ‘for rent,’ further depressing single family detached construction

And thus, the likelihood of an inventory spike (think 2008) is extremely low and will remain low for the foreseeable future. Building isn’t going to provide the solution and now resales will also become far more scarce for the reasons discussed above.

As a matter of fact, I think the inventory issue is more likely to get worse than better once the market settles in and the Fed stops trying to squeeze out inflation –– but I seem to be in the minority in that opinion. I guess time will tell.

Don’t Mistake What I am Saying

Does .72 hold true for all markets? No, of course not.

Every market and every segment has its own set of dynamics.

Furthermore, just because inventory is low does not mean prices will rise at the maximum rate. If you notice on Shiller’s index, a market with 4 months of inventory can appreciate anywhere from 3% per year to closer to 12% a year, so it varies quite a bit.


Here is a sample of inventories across the RVA region:

  • Western Hanover (Zone 36) at $600K is currently 4.3 months due to several new neighborhoods where construction is prevalent
  • Downtown neighborhoods (Zone 10) at $800K is 1 month
  • Forest Hill Corridor (Zone 60) is pretty much 1 to 2 months at all price points
  • Goochland (Zone 24) at $600 / 700K is closer to 9 months, mostly due a lot of construction.

So don’t mistake this blog for saying that the market isn’t subject to adjustments, only that far more segments than not are still in extremely low inventory conditions and the ability to add new housing at scale and at affordable prices is next to impossible.

Summary

Look, it is easy to believe in the idea of that which goes up, must come down. 

But this idea of gravity and prices ignores the underlying inputs –– Millennials paying record rents are trying to become owners despite the fact that there aren’t enough houses to go around. 

Sorry, I don’t care that mortgage rates have doubled. Mortgage rates have not fixed the fundamental problem –– in some ways, the increase in mortgage rates have made the problem worse by shifting the buyer pool down the price gradient where even less housing is available, but I digress.

No, the real problem, which we are not currently seeking to solve, is that we can’t build houses fast enough or cheaply enough to satisfy the demand. The layers of regulation at all levels (federal, state, local, neighborhood) have made homebuilding an incredibly compliance-based endeavor –– and I don’t see any of the regulatory oversight of homebuilding becoming less problematic … ever.

Besides, this problem is not new. We tend to forget that housing prices were rising quickly well before COVID –– as a matter of fact, the affordability issue was easy to see coming.

How easy? We wrote this article in 2016.

So keep your eyes on not just inventory in the aggregate, but in your area and price band specifically. Odds are, unless you live in an area where new construction is prevalent, your inventory count is still 2 months or less –– meaning that your prices are in no danger whatsoever.

And to the buyers, if you are waiting for a market correction, I think you may be waiting for a while. Yes, competition has thinned to some extent, but as long as housing supply stays below demand, prices will continue to climb.

We’ve Moved!

June 9, 2022 By Rick Jarvis

13 years.

Over 150 blogs.

3,500 pages.

1 million visitors.

And now we are moving. 

RichmondVAMLS.net, the home of the Sarah Jarvis Team at the One South Realty Group will now become RichmondRelocation.net and get a little facelift as well!

It Was Time

As the market has evolved and how people search for housing has as well, we felt it was time to migrate our site and upgrade some behind the scenes technology to better serve our existing clients, as well as those we are destined to meet.

Yes, we will continue to write and keep you informed with the latest analysis of our ever-changing market, as well as be available to answer any and all questions you may have –– just like we have done since we started our site back in 2010.

So over the coming weeks and months, we will be tweaking, installing, revving, and otherwise improving the user experience at our new home on the web.

See You Soon!

Sarah, Kendall, Jenny, Jenny, and Molly

The Sarah Jarvis Team at RichmondRelocation.net

  • Go to page 1
  • Go to page 2
  • Go to page 3
  • Interim pages omitted …
  • Go to page 31
  • Go to Next Page »

Primary Sidebar

804.201.9683


How Do I Schedule a Showing or Find Out More?

I am Kendall C. Kendall, Client Care Coordinator for the team. I am a licensed Realtor and it is my job to answer questions and schedule showings for the properties shown on our sites. Here's our call policy.

kendall@richmondrelocation.net

Working With Buyers

I am Sarah Jarvis, Broker at One South and I work with our buyers. I bring 20+ years of experience to our Buyers Advocacy program and take great pride in helping our clients understand the RVA marketplace.

sarah@richmondrelocation.net

From the Blog

Things to Consider for Vacation Rentals

The Vacation/Second Home Market

We recently had a past client ask us about buying a beach house. The question was basically this - ‘Is it a good time to invest in a vacation rental/second home property?’ The answer is 'yes' -- but with a lot of caveats AND provided you understand the basics. In full disclosure, we own properties …

[Read More...] about The Vacation/Second Home Market

More Posts from this Category

  • Facebook
  • Instagram
  • LinkedIn
  • Twitter

The Ultimate Stats Page

Ultimate Stats Page

Latest Tweets

  • It’s wise to follow mortgage rates, but don’t get to caught up nitpicking the rates, because once your locked in th… https://t.co/qLAjQT1QNf March 10, 2023 7:39 pm
  • Are you viewing a housing asset correct? ⁣ #rvahousing #rvarealtor #rvarealtors #rvahousinginsights… https://t.co/gJtuSo6Wkh March 10, 2023 7:35 pm
  • Your miscalculation could cost you. ⁣ #rvahousing #rvarealtor #rvarealtors #rvahousinginsights #onesouthrealtygroup… https://t.co/RqwoqwXaKH March 10, 2023 7:08 pm
  • Don’t lose money in real estate. Work with a trusted agent to build wealth through real estate. ⁣ #rvahousing… https://t.co/IRTHSroHBL March 10, 2023 7:05 pm
  • The market dictates pricing.⁣ ⁣⁣ #rvahousing #rvarealtor #rvarealtors #rvahousinginsights #onesouthrealtygroup… https://t.co/ArRaru8q2j March 6, 2023 8:25 pm

804.201.9683


How Do I Schedule a Showing?

I am Kendall C. Kendall, Client Care Coordinator for the team. I am a licensed Realtor and it is my job to answer questions and schedule showings for the properties shown on our sites. Here's our call policy.
kendall@richmondrelocation.net

804.305.2344


How Do I Determine What I Can Afford?

With over a decade of mortgage industry experience, Southern Trust Mortgage knows what it takes to provide the very best service for each of their clients and truly believes in forming lasting relationships with their customers.
www.southerntrust.com
Southern Trust Logo

Equal Housing

The Sarah Jarvis Team agrees to provide equal professional service without regard to the race, color, religion, sex, handicap, familial status, national origin or sexual orientation of any prospective client, customer, or of the residents of any community. Any request from a home seller, landlord, or buyer to act in a discriminatory manner will not be fulfilled.

IDX Disclaimer

All of the information displayed here is deemed to be gathered from reliable sources but no warranties, either express of implied, are made part of this site. Additionally, the IDX Feed for listing information may contain descriptions of properties not represented by One South Realty, its agents or staff and any violations or misrepresentations are the sole responsibility of the listing brokerage of the subject property in violation.

Our Network of Sites: RichmondVaNewHomes.net, RichmondVaCondos.net, RichmondLuxuryNeighborhoods.com,
RichmondFanRealEstate.net, RichmondVaMLSSearch.net
Housekeeping: Sitemap, Listings Sitemap


Members of the Sarah Jarvis team are licensed in the Commonwealth of Virginia.


Loading Comments...