• Skip to primary navigation
  • Skip to main content
  • Skip to primary sidebar

Sarah Jarvis Team at One South Realty

at One South Realty

  • Search MLS
  • Stats
  • Deals!
  • About Us
    • The Team
    • Testimonial
    • 5 Things I Tell My Clients
  • Calling Policy
  • The Blog
  • Show Search
Hide Search

Market Values

Flipping Houses in a Static Market

March 13, 2013 By Rick Jarvis

flipping
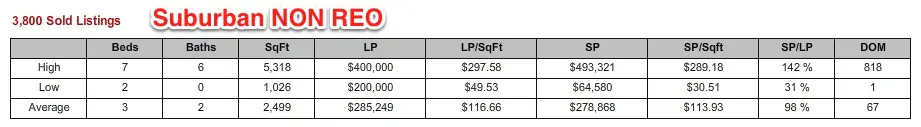
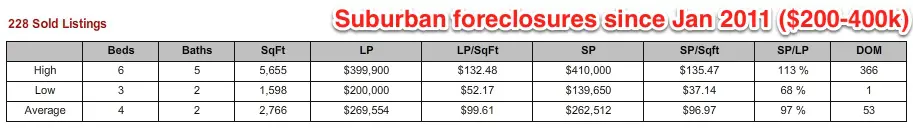
As we find 2010/11 a smaller and smaller object in the rear view mirror, the real estate world appears to be returning to some sort of normalcy.  The number of foreclosed properties is down as is the number of short sales. As you can see below, the number of REO Properties (Bank Owned), while still available in numbers above the levels before the adjustment, are still down considerably from darkest days of 2010 and 11.

The impact of this is twofold.

First, the opportunity to find cheap homes is far lower now than even 2 years ago.  Foreclosed properties (a list can be found here) have always provided the ‘flipping’ community with ample numbers of homes to purchase, at discounts, to be fixed up and resold.  While several lending rules were put in place to discourage the abuse of the system (which in reality, was another poor policy that prolonged the slump), there were still those that found homes cheaply enough to purchase and renovate despite a still declining market.

The number of cheap homes (and by cheap, I mean priced artificially low for quick sale) in the market are largely gone.  As we move into 2013, the collective inventory of homes for sale, both REO and non-REO, are approaching critically low levels.  Many neighborhoods, especially those mature urban neighborhoods with higher values, are off by 70-80% of their traditional available supplies (see the chart below of inventory levels in 23221 zip code)


Secondly, the removal of the large swath of foreclosures from the marketplace means that we should begin to see some slight improvement to the collective market values of homes across the US.  These slight increases will be stronger in some places than others (see the Back to the Future Series) as the the lack of available inventory drives prices higher.  Any market whose property values are increasing is obviously a great thing for ‘Flippers’ as the assets they own are increasing in value during their hold period.

So what does this mean?

It means that prices are heading higher until we size supply correctly and that it will be harder to find homes to flip.  It also means that the community of ‘Flippers’ will need to look elsewhere for opportunity.  Homes with unfinished spaces that can be completed for a reasonable cost and are located within neighborhoods that support the additional value will be an avenue to find opportunity.  The other will be to find homes in need of additions.  The 3 bedroom 1 bath colonials or cape cod styled homes in many of the neighborhoods built during the 1920-1940’s are one area.  Smaller Fan and Museum District homes are also good targets.

The days of the easy ‘Flip’ are somewhat over and in order to continue to make money as a ‘Flipper’ one must become increasingly skilled as a contractor.

Back to the Future – Midlothian

March 3, 2013 By Rick Jarvis

back to the futureA few weeks back, one of the agents in our office called me during negotiations on a home in the West End. The owner of the property had purchased the home in 2006 and the question was asked, ‘How do we stand compared to 2006?’

It spawned this totally informal study.

This is the second installment in the series on pricing levels throughout Richmond.  This article will focus on Midlothian (the first installment discussed The Fan District pricing.)

So here goes…

Where Do Midlothian Property Values Stand in 2013?

For this exercise, we are using more of an ‘Old School’ definition of Midlothian by using a combination of Zone 64 and Zip 23113 to form the boundaries in the study. The newer definition of Midlothian encompasses much of the area between Midlothian Turnpike and Hull Street (MLS Zone 62.)  We will examine that area in a future installment as the number of new homes there is greater than almost any other area of Richmond.

The area being discussed in this analysis is comprised of many of Chesterfield’s most valuable residential areas.  Neighborhoods such as Salisbury, Tarrington, Founder’s Bridge, Oak Park and the neighborhoods along Cherokee/Old Gun are also a part of the data.  Charter Colony, Hallsley, The Grove and neighborhoods south of Route 60 are not part of the data.

So what does Case Shiller say?case shiller


The chart above is the gold standard for home pricing.  The Case Shiller Index measures both the Top 10 and Top 20 largest metro markets in the US and tracks both the prices of the homes as well as the appreciation rates in each market. It should be noted that Richmond is NOT one of the cities in the index (the two geographically closest markets that are measured are Washington DC and Charlotte NC, in case you were wondering…) It is also worth noting that the CS Index measures home pricing and not the Price Per SF.  When the market soared, many large homes were built that skewed the appreciation and depreciation within each market.  Secondarily, some of the largest price increases occurred in markets that became the most overbuilt, also skewing down the average.

According to Case Shiller’s latest press release, as of December 2012, the pricing for homes nationally had returned to 2003/4 levels.

According to CVRMLS (our Multiple Listing Service), the Midlothian area (as defined at MLS 64/23113) yielded the following ‘Per Foot’ pricing in 12 month increments beginning in 2005.

  • 2005 – $143/SF
  • 2006 – $154/SF
  • 2007 – $154/SF
  • 2008 – $141/SF
  • 2009 – $135/SF
  • 2010 – $127/SF
  • 2011 – $124/SF
  • 2012 – $122/SF

The data suggests that the pricing in the NW Quadrant of Chesterfield is probably consistent with the national average.  While the peaks and valleys in the Midlo market mirror the national peaks valleys in terms of time, the level of decline was not as severe (by 5-7%).

Midlothian, compared to The Fan, is lagging.  However, the Fan District is less seasonal than the suburban marketplace.  With the spring market around the corner, the 2013 market in places like Midlo, with its top notch public schools, strategic Chesterfield location and relatively smaller number of new homes and lots to be absorbed, should be in for some level of recovery as we move through the year.  The number of homes sold in 2012 was greater than both 2011 and 2010, which is a positive sign and the inventory levels are also as low as in recent memory.

Midlothian is still in stuck 2003, but expect a 2-3 year jump forward soon.

Next up, Ginter Park and Bellevue…

Is It the Right Time to SELL a Home?

February 21, 2013 By Rick Jarvis

sell
While selling housing is not the same as trading frozen orange juice, if you have a quality property, it can almost feel this way.

Google shows almost 14 Billion* results for the following search “Is it a good time to buy a house 2013”

Google shows only 2.6 Billion* results for the following search “Is it a good time to SELL a house 2013”

Really?

Is it 6x better to buy than sell?  Doubtful.

Is there 6x the selection available?  Hardly.

Is the interest rate 6x lower than it used to be?  Not really…we were around 6.5 to 7 before the market went ‘boom’ in 2008.

[ For a list of the markets that are most undersupplied, click here, here, here, here, here and here ] 

Why are there 6 times more articles about buying than selling?

I think it can be framed in this manner – it is far harder to sell than it is to buy and the messages that you have to deliver to the sellers are far harder than the ones you have to deliver to the buyers so agents continue to offer advice to the buyers of the world…it is just easier.

Here is what the sellers are up against:

  • Sellers, in many cases, are still fighting the collective leverage (mortgage debt) placed against properties as late at 2007
  • Sellers, in many cases, are reluctant to lock in losses (human nature)
  • Sellers, in many cases, are left with no down payment after payment of commissions and other expenses
  • Sellers, in many cases, are the ones who bear appraisal risk (and this is a significant issue)
  • Sellers, in many cases, are the ones who bear the timing (OMG!  Where am I going to go if I sell quickly???)

These are all legitimate and powerful concerns but they can be navigated.

To the sellers of the world, I offer the following advice – you are not in the position that CNN and Yahoo tell you that you are or that agents want you to believe.

  • The fact that Realtors are screaming 6 times as much about buying than they are about selling is driving people to your door step
  • The fact that inventory in the good markets has declined by 60-70% in many cases means you have far more leverage than you think you do
  • The fact that the last 4 deals I have personally been involved in have resulted in multiple offers means you have options

The same factors that drove the market to dizzying heights and unfathomable lows within a 36 months has largely played out and the market is within 5-7% of its pre-bubble trend line.  Our path from 1990 to 2003 with minor adjustments for economic factors puts us on a value path that is not too far from where we are now.

What does that mean?  We are in a normal market.

Here are the basic scenarios:

  • If you are a seller of a quality property in an undersupplied mature neighborhood, you are fine.  Price with ‘reasonable aggression’ but be mindful of comparable sales if you are likely to be purchased by a debt buyer.  Use the higher comps in your market and/or the PENDING properties as the best pricing guide.
  • If you are a seller of a quality property in a balanced neighborhood, then spend some time on the absorption rate (ask your real estate professional with help on this) to get a feel for timing.  Balanced markets with good school districts will largely follow statistical trends in terms of Days on Market and Ask/Sold price ratios.  Comparable sales are important in your analysis.  Use comparable SALES as the guide.
  • If you are a seller of a challenged property or in an oversupplied market, it could take a while.  Be very conservative in your pricing and price near the comparable lows in your market.

If you are thinking about selling but are unsure, then seek competent advice.

Obviously, we would be happy to help…

(* the numbers of searches that match the terms may bounce around a bit for a variety of factors)

Are Foreclosures Good Deals?

February 20, 2013 By Rick Jarvis

It depends.


According to the statistics below, since 2011, in suburban Richmond, the REO market (Real Estate Owned by banks)  accounted for roughly 5.6% of the market (228 of 4,028 sales) and traded at an average of nearly 15% lower ($114/SF to $97/SF), respectively.


If this $16/SF difference is viewed in the context of a 2,500 SF home, then the average price difference is $40,000.


Is that enough?


It has always been a buyer tendency to over-estimate the cost of repairs.  People that walk into a home that is in need of paint, flooring, appliances and light to medium drywall repair and feel put off by the repairs.  “If the naked eye can see the items in the home that are in need of repair (they reason) then what CANNOT be seen is something that will bite them later.”  It is a legitimate fear but one that is often over-estimated and thus, REO property gets discounted more heavily than non-REO property.


Does that mean that you should seek REO property?  This doesn’t suggest that you should or shouldn’t but it does suggest that REO property is treated differently than non-REO property.  It also gives insight to the bank’s view of the property they own and their expectation of the value at which they should sign an offer.


The following list contains primarily suburban REO property that is priced between $200 and 800k.  The information on this site may lag up to 48 hours as do all IDX search sites.


Contact us at 804.201.9638 (our call policy) for an up to the minute/real time list of all distressed property.

Richmond’s Hottest Zones

January 30, 2013 By Rick Jarvis

Calling All Sellers!

The last two sales in the Fan District that we have been involved with both resulted in multiple offers…and when we say multiple offers, we mean 5 (or more) on a home.  And, no, this is not a reprint of an article from 2007.

How can this be?

The best way to think about the market right now is that there are two markets for housing, both operating concurrently and both behaving in radically different manners.  These two markets can exist almost adjacent to one another and are barely distinguishable from the other one.  The only way you can tell one from the other is by the result…immediate sale or extended days on market with no offers.

The first market, the RED hot one, is the market for “GOOD Housing.”  GOOD Housing can be defined as well designed, well maintained, fairly priced and in areas whose supporting amenities (schools, walkability, culture, architecture, history, shopping) are superlative.  Another characteristic is the inability to provide any new inventory (or at least very limited ability) to the market.  Richmond’s Fan District, Richmond’s West End (Westhampton, South of Cary, Libbie/Grove, Bellevue and West Ginter Park) all share these characteristics.  Many of these areas, at the upper-middle to lower-middle price points, are in the throws of a full on recovery.

The market that is struggling is the market for “BAD Housing.”  Homes that are poorly maintained, in poor school districts or located in areas where the amenities have not caught up to the residential development or where there are new homes being built on lots bought from banks at a sever discount, are struggling.  Sometimes what puts the home in the BAD category is a pricing or condition flaw.  Other times, it is a flaw that cannot be easily remedied.

It is imperative that the sellers and buyers recognize which side of the market they are on.  Expecting to buy a quality home that is new to the market requires quick action and a strong offer.  Selling a home with a flaw based on the anecdotal evidence of a friend or co-worker having a bidding war for their home is also a flawed strategy.

  • « Go to Previous Page
  • Go to page 1
  • Interim pages omitted …
  • Go to page 19
  • Go to page 20
  • Go to page 21
  • Go to page 22
  • Go to Next Page »

Primary Sidebar

804.201.9683


How Do I Schedule a Showing or Find Out More?

I am Kendall C. Kendall, Client Care Coordinator for the team. I am a licensed Realtor and it is my job to answer questions and schedule showings for the properties shown on our sites. Here's our call policy.

kendall@richmondrelocation.net

Working With Buyers

I am Sarah Jarvis, Broker at One South and I work with our buyers. I bring 20+ years of experience to our Buyers Advocacy program and take great pride in helping our clients understand the RVA marketplace.

sarah@richmondrelocation.net

From the Blog

Elmo is confused

Uncertainty

I have never met someone who loves uncertainty. Making decisions under pressure, not having the luxury of all of the facts, guessing about the future  –– these are all unnerving feelings. But they are all a part of every real estate transaction. Guess what I do for a living? I am a …

[Read More...] about Uncertainty

More Posts from this Category

  • Facebook
  • Instagram
  • LinkedIn
  • Twitter

The Ultimate Stats Page

Ultimate Stats Page

Latest Tweets

  • Just now

Footer 1

Test Text

804.201.9683


How Do I Schedule a Showing?

I am Kendall C. Kendall, Client Care Coordinator for the team. I am a licensed Realtor and it is my job to answer questions and schedule showings for the properties shown on our sites. Here's our call policy.
kendall@richmondrelocation.net

804.305.2344


How Do I Determine What I Can Afford?

We offer competitive mortgage solutions with a commitment to exceed your expectations. We’re local industry experts who are also your friends and neighbors. Whether you want to communicate online or in person, we’re just a call or click away.
www.cfmortgagecorp.com
C&F Logo

Equal Housing

The Sarah Jarvis Team agrees to provide equal professional service without regard to the race, color, religion, sex, handicap, familial status, national origin or sexual orientation of any prospective client, customer, or of the residents of any community. Any request from a home seller, landlord, or buyer to act in a discriminatory manner will not be fulfilled.

IDX Disclaimer

All of the information displayed here is deemed to be gathered from reliable sources but no warranties, either express of implied, are made part of this site. Additionally, the IDX Feed for listing information may contain descriptions of properties not represented by One South Realty, its agents or staff and any violations or misrepresentations are the sole responsibility of the listing brokerage of the subject property in violation.

Contact The Sarah Jarvis Team

804.201.9683

One South Square Logo

2314 West Main Street Richmond, VA 23220

sarah@richmondrelocation.net

Our Call Policy

Accessibility
Copyright

Lending

Southern Trust Mortgage Logo

Chris Lester
Senior Loan Administrator
NMLS# 353830
804-307-7033
Email Southern Trust Mortgage

Our Network of Sites: RichmondVaNewHomes.net, RichmondVaCondos.net, RichmondLuxuryNeighborhoods.com,
RichmondFanRealEstate.net, RichmondVaMLSSearch.net
Housekeeping: Sitemap, Listings Sitemap


Members of the Sarah Jarvis team are licensed in the Commonwealth of Virginia.


Loading Comments...