The Next Crisis in Housing, and the 2018 Predictions
Each year, as December comes to a close and the promise of the new year begins, I try to share my thoughts on what the next 12 months will bring. And while I am not an economist, I did stay at a Holiday Inn Express last night … does that count?
(And here are 2017’s predictions, if you care to see how well we did)
I love data and what it can tell you if you look a little bit deeper. Furthermore, when you can add empirical evidence to anecdotal, you get some powerful intel about not only where the market is headed, but why it is headed where it is.

What the next 12 months will bring is important for all of us to know — from renters in Shockoe, to homebuilders in Chesterfield, to land owners in Goochland — in order to place our real estate holdings in the best position possible.
And just so you know, the words we will hear repeatedly in 2018:
- Inventory
- Interest rates
- Affordability
- Millennial
Inventory — Richmond, We Still Have a Problem
Unless you have been living under a rock (which also appreciated by about 4.8% last year), you have heard about the inventory crisis. Bidding wars are up, ‘Days on Market’ are down, houses are going for more than their asking prices on a regular basis, and everyone is clamoring for more inventory to help fix the problem.
If this chart doesn’t illustrate the extent of the problem, nothing can. This shows the available housing supply over the last 10 years.
In the aggregate, inventory levels are off by well over half from the heights in 2008 through 2010, and that doesn’t even look at the sub markets individually.
Now lets look at the buyer pool. The chart below tracks the number of houses that go under contract in any given month over the past 10 years (i.e. — absorption of housing)
Do you notice a trend?
The rate of sales, while not up anywhere as much as the inventory is down, it is still up by about 30% from the 2007-2011 period. As a matter of fact, there are actually more houses selling now than there were in 2007 and 2008.
So, just to reiterate:
↑ Absorption is up by about 30%
↓ Inventory is down by 60-70%
Yeah, that pretty much explains the price increases.
While I think we all recognize the inventory issue, unless you look at it critically, the deeper message is lost. What has really been happening is that population is realigning where it wants to live, impacting housing availability differently in individual sub-markets.
The Fall and Rise of the City
In the late 1980’s, Chesterfield, Henrico, and the City of Richmond were all populated equally with just over 200,000 residents each. Only a decade later (by 2000), the City’s population had fallen below 200,000 while both Chesterfield and Henrico had exploded to over 260,000 residents each.
It was an incredible shift.
Where Are the New Urban Houses?
But if you fast forward to today, what do you see? You see a city with a population growing at the same rate as the surrounding counties, if not slightly faster. And while growth of the urban core brings with it many positives, it poses a big problem with what is a fixed supply of housing.
Take a look at the table below — despite the same basic rate of growth in population, the number of new houses being built in the city accounts for anywhere from 4 to 6% of the overall market. When you compare that to 15 to 21% of the sales in Chesterfield being newly constructed homes, you begin to see the extent of the problem.
|
Year |
New Homes in the City |
Resale in the City |
% |
New Homes in Chesterfield |
Resale in Chesterfield |
% |
|
2012 |
83 |
2110 |
3.9% |
550 |
3588 |
15.3% |
|
2013 |
121 |
2356 |
5.1% |
723 |
3785 |
19.1% |
|
2014 |
113 |
2370 |
4.8% |
729 |
3818 |
19.1% |
|
2015 |
108 |
2461 |
4.4% |
828 |
4467 |
18.5% |
|
2016 |
150 |
2629 |
5.7% |
934 |
5039 |
18.5% |
|
2017 |
154 |
2672 |
5.8% |
1022 |
4819 |
21.2% |
All cities, not just Richmond, lack sufficient land to develop housing with any scale. And when the population begins to seek housing in the urban environment, it puts pressure on the fixed stock of available housing. When supply is fixed and demand rising, you get rapid price increases. When supply can be added to offset demand, you might still see prices rise, just not at the same rates.
Richmond’s Affordable Housing
So where is the problem the most acute? In the affordable urban markets, that’s where.
The table below shows the number of sales in excess of $300,000 in the north and eastern quadrants of the city of Richmond, long a bastion of affordable housing. The number of transactions over $300,000 has increased from 15 to 129 in the past 5 years — nearly a 900% increase!!
Compare this to west/central Chesterfield and, while you still see a problem, a 264% increase to be exact, it’s not quite as dramatic. Furthermore, the ability for Chesterfield (or Henrico, or Hanover) to manage their affordability issue is far greater as they still have hundreds of thousands of acres to develop to relieve the pressure.
| Primary Year | Number of Sales Above $300,000 in NE Richmond City | Number of Sales Above $300,000 in West Central Chesterfield |
|
2012 |
15 |
318 |
|
2013 |
29 |
379 |
|
2014 |
38 |
451 |
|
2015 |
56 |
620 |
|
2016 |
88 |
812 |
|
2017 |
129 |
842 |
The Problem Becomes a Crisis
In my opinion, this lack of urban housing will make 2018 the year Richmond’s affordable housing problem becomes an affordable housing crisis.
So if you are looking for urban housing, especially a more ‘affordable’ home in the city, here are some strategies you should employ to make your efforts as successful as possible:
- get started earlier than normal
- steer clear of online lenders as sellers — ok, seller’s agents — hate Quicken and USAA. Oh and their rates are the same, if not worse, so don’t believe the hype
- expect to be involved in a bidding war
- don’t rely solely on last year’s comparable sales to dictate predict pricing
- act with urgency
(And if you want to read a reeeeeallly deep dive on affordable housing, you can do so here — The Affordable Housing Post)
Interest Rates
I think we have all been dreading the day when rates will rise. Sorry, but I’m calling it. Rates will rise in 2018 and continue to do so until they return to ‘normal’ levels in the coming 3 to 5 years.
Why? The economy is actually pretty healthy. Tax breaks, North Korea, and bipartisan bickering aside, we are doing pretty well, at least economically. Yes, we have crushing debt that our children’s children’s children will have to deal with, but all in all, employment is solid and the economy is growing at a decent pace.
So what is a ‘normal’ interest rate? I think the new normal remains to be seen as the inputs have all changed, but 6% to 7.5% or so for 30 year mortgages is what I think most industry veterans would consider to be ‘normal.’
Inflation
One of the primary drivers of interest rates (ok, mortgage rates) is inflation and when the market sees that inflation is creeping up, the price of money rises to hedge the loss of buying power over time. Stated differently, when you borrow money, each dollar you repay the bank has lost a little bit of its value. And while dollar today will have a similar value tomorrow, how much buying power is lost 5, 10 or 30 years in the future? You get the picture.
So the more inflation the market expects, the higher rates will rise, and as you can see, the trend line, while still below historical norms, seems to be moving up more than it is moving down.
And when you take the same chart and add historical mortgage rates, you see what is a pretty strong correlation. As inflation expectations rise, the interest rates tend to do the same thing (at least once the housing market stabilized in 2013.)
So if you want to know where the mortgage rates are headed? Keep an eye on the inflation expectation in the market. It will tell you (most) all of what you need to know.
Rising Rates — Good or Bad?
So are rising interest rates a bad thing? Does it matter if that rates are in the 5’s, 6’s, or <gasp!> even in the 7’s if the economy is roaring? If salaries are up, the stock market is at record highs, and profits are everywhere, does a mortgage payment 15 to 20% higher than today really matter?
As you can see, the percentage of our collective incomes that we spend on housing is not nearly as out of whack as it was in the years preceding the bubble — and that makes me feel good.
Do you know what else makes me feel good? The amount of housing debt we currently have outstanding relative to where we were. (And, for what it is worth, I am yet to see a chart that better illustrates the ‘bubble’ and the impact of it’s bursting …)
The bottom line is that we are still well below the debt levels of the bubble, and we are spending less of of our incomes on housing.
And also know that, as rates rise, people will begin to use loan products with built in rate adjustments to offset the increased mortgage payments.
Which leads us to …
Adjustable Rate Mortgages (ARMs) and 2018
Wait, did I just say adjustable rate mortgage?!? Isn’t what that got us in trouble the last time?!? Aren’t those loan products evil, and dangerous?!? Oh no, we are doomed!
Don’t panic …
In 2008, these were the reasons we developed a bubble, not the existence of the adjustable rate mortgage:
- Credit score requirements were essentially non-existent
- Verification of salary, job history, and liquid assets, all of which should have been confirmed by underwriters and processors, were not
- Intentionally fraudulent (think — criminal) underwriting was far too common
- Down payment requirements were as low as 0% (or even lower in some cases — do you remember the 125% mortgage?!?)
- Many loans were interest only
- No rate caps during each adjustment period
So when you allow someone with no liquid assets, a shaky job history, and basically no skin in the game to buy a house with a payment that will not only double in a year, but never pay down the debt, then yeah, you have a big problem.
The ARMs of Today
The adjustable rate loan products today look nothing like the adjustable rate products of 2006-2008. Today’s ARMs have realistic rate caps (meaning how much they can rise is limited), less frequent adjustment periods (every 3 years, 5 years or 7 years), and are underwritten to higher standards for income, debt, job history, and down payment.
So don’t worry, the adjustable rate mortgage that will soon reappear will be strategically used by buyers who are making a bet about how long they will live in a home, and not as bait to lure ill-prepared buyers into a ticking time bomb.
And the chart (below) showing homeowner ship rates in the US would seem to corroborate that statement.
The mortgage practices that created the 2008 bubble seem to not be in practice today.
Home Building
I’m worried about Richmond’s home building industry.

Am I worried it is going to crash? No, not at all. I think you might see a little softening at some of the upper price points, but nothing to worry about.
Am I worried about the land developers? Not really, provided they have enough Xanax to deal with the public process that rezoning and development has become. But headaches aside, creating lots right now is not where the danger is (like it was in 2008.)
Then who am I worried about? I am worried about Richmond’s smaller and mid-sized, LOCAL homebuilders right now. They are in trouble if they don’t understand what is coming at them and adjust their business models.
Subs Rule
So imagine you are a subcontractor — bricklayer, carpenter, plumber, roofer, etc. — and you are bidding a job in Richmond for a local homebuilder. You turn on CNN and see Hurricane Harvey flooding out Houston ($200B in damage), followed immediately by Irma ($67B in damage) cruising up the gulf coast of Florida flooding out houses and ripping off roofs. And then a few short months later, you see that California is completely on fire (and still is as we write this article) with entire communities going up in flames instantaneously.
So what do you do? Do you pack up the van and move to Houston, Tampa, or Santa Barbara to set up shop for the next several years while rebuilding beachfront mansions on the insurance company’s dime? Or do you simply add 20 to 30% to your bid knowing that many of your competitors are already on 64W or 85S to do exactly that.
In 2008, when new homebuilding essentially ceased, much of the homebuilding labor pool disappeared. They retired, got other jobs, or simply left the business altogether. So when you combine an already reduced labor pool with a sharp demand increase in extremely affluent markets (i.e. — California / Florida’s gulf coast) destroyed by recent natural disasters, you can imagine the impact not only on the price of labor, but of materials.
The Big Guys Have Arrived
And if a spike in labor and materials is not reason enough to stress, Richmond now is home to two new regional / national homebuilders who bring efficiencies and economies of scale that can suck all of the margins out of a market.
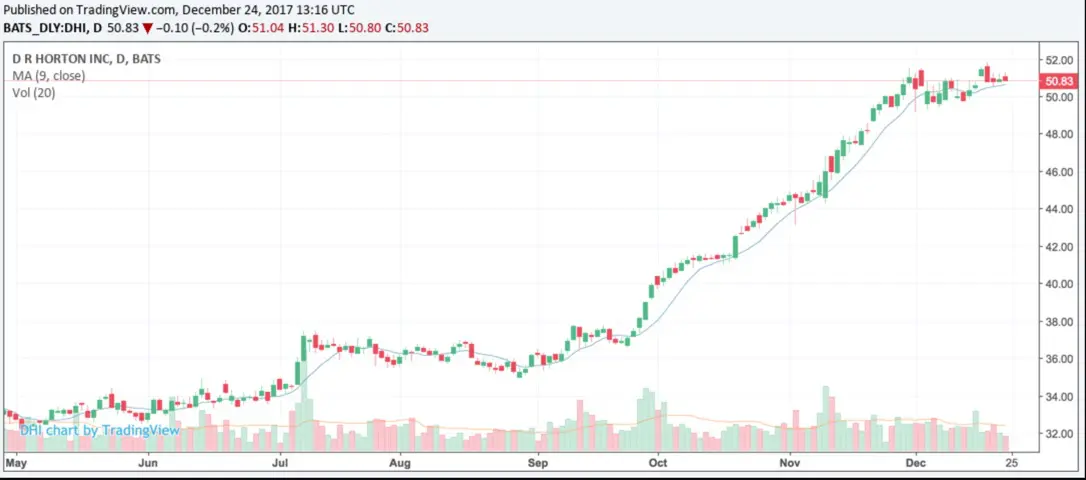
DR Horton, the nations LARGEST homebuilder, and Schell Brothers (only #74 if you are scoring at home, but still an extremely large regional homebuilder), arrived in 2017. Stanley Martin, #57, arrived in 2015, and lets not forget about NVR / Ryan Homes (#4 overall) that has been building in Richmond for decades.

The big guys come with unlimited buying power to take control of the available lot inventory, the ability to build models that contain every imaginable option to wow the public, a sales organization designed to hook the buyers with low prices and then upgrade the heck out of ’em, the promise of volume to suck up all of the labor, and engineered floorpans that can be built at significant cost savings.
AND (and this is a big AND), the national builders build fast. When they get rolling, they can produce housing at an incredible rate. When the music stops (and it will, but I still don’t think it is anytime soon), overproduction will impact both the rate and the length of the housing adjustment. So when they decide the time has come to cut prices and unload inventory, their actions can really hurt the smaller guys whose pockets are not nearly as deep.
Local vs. National
When compared to the smaller and mid-sized builders that have traditionally populated Richmond’s building scene, you can see how the future for our local guys will be far more difficult.
In 2018, I think you will see a fundamental shift in power from the 5 to 50 home per year local builder to a 100 unit-per-quarter type publicly traded builder, especially at the middle and upper price points, whose production machine will change the way Richmond builds (and buys) houses.
So while home pricing might be going up and demand is still rising, building costs are rising even faster and competition from extremely well funded large builders is rising as well. Much like the impact WalMart and Target had on local retail, the arrival of the big builders will drive down margins to levels that will make building a very dangerous endeavor for those who lack the ability to build at greatly reduced costs.
And I am not ok with that, if you care to know. Maybe it is the prideful Richmonder in me, but I don’t like the idea of national homebuilders determining our local stock of homes and the Richmond stalwarts getting squeezed.
So What Does it Mean for the Local Guy?
It means being nimble, opportunistic, and above all else, smart.
Going head to head with Ryan, DR Horton or even local behemoths like Eagle or HH Hunt is a no-win game. The new way will be more of a hit and run model, seek opportunity where others are not looking, operating in markets where it is difficult to find scale (think — infill and urban markets!), and/or establishing a specific stylistic niche that will cause clients to seek you out.
Trying to beat a national volume builder with endless capital is like trying to beat a Las Vegas casino — over time, the casino always wins. Their cost of capital, cost of labor and materials, access to lots, and sales infrastructure give them a 10 to 15% baked in advantage — and those advantages are really hard to compete with day in and day out.
The Commercial BOOM
Most of you probably realize that One South is a mixed-use firm that offers residential sales, commercial sales, and development representation, and thus we can speak about the commercial market a bit as well.

The commercial market is rolling, in case you haven’t heard.
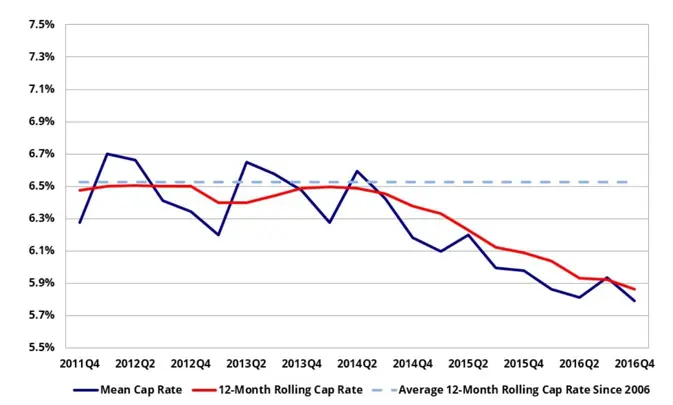
Without going into too much nitty gritty detail, pricing on the commercial side is pretty insane. Cap Rates (which represent the ratio of income to price) have shifted significantly in the past 24 months – about a 2 to 3 point shift – especially for multi-family opportunities.
When Cap Rates shift from 7% to 5%, a property that used to cost $1,000,000, will now trade closer to $1,400,000. That’s no small change.

Why the Shift?
The reasons are many but what is driving the market as much as anything is an influx of out of town buyers who have been priced out of the larger metropolitan areas (D.C, NYC, Charlotte) looking for deals in Richmond. Richmond’s improving profile and exploding local scene, as well as the insatiable appetite for apartments mostly driven by VCU, has given larger regional and national players in the multi-family scene reason to stop in and buy up our buildings. And when they look at our relative value, they feel excited to pick up properties here that are fully leased, well built, and extremely well located.
So to Summarize
If you made it this far, thanks.
And while we covered a lot, we didn’t even touch on rising rents, the Bus Rapid Transit that has physically destroyed Broad Street, the condo market, college debt, or tax breaks, either!
I guess we’ll save those topics for another day.
But don’t worry! Despite rising pricing, 2008 redux is not on the horizon. The conditions that existed in 2008 do not, I repeat, DO NOT exist currently. (And if you want to dive in deeper to the differences, you can read this article — The B Word, Bubble — that we wrote last year.)
Can pricing continue to rise unabated?
If demand outpaces supply, then yes it can.
Are we seeing some some softness in the suburban new home markets at upper price points? Maybe. But as a whole, the market is still significantly undersupplied.
Furthermore, there is neither a fix for the supply issue (other than building more homes further and further from the urban core) nor a likelihood that the first time homebuyer will give up and stay a tenant. As a matter of a fact, I actually think the buyer supply will increase as more and more millennials decide to become homeowners and the supply problem will get worse before it gets better.
Will interest rates rising make housing more expensive to own and temper prices?
Perhaps, but when our wallets are fat and our confidence high, then we buy, even if our mortgage payments take a little more of our disposable income. I don’t think we will see prices flatten until we see 2 to 3 points of increase in long term mortgage rates.
So if you are getting ready to buy …
Prepare yourself.
It is a highly competitive market, especially if you are looking at urban markets or for quality affordable housing.
If you are thinking of selling …
Make sure to extract the correct terms from your buyer that will allow you to re-purchase comfortably and without undue stress (just ask us how!)
And if you decide to build a new home …
And you are buying it from one of the large builders in Richmond with a flashy showroom and highly skilled upgraders, beware. They are reeeeeallly good at their job.


 Fishing.


