Early each spring, the trees begin to bud, the birds and squirrels begin to be seen with more and more regularity and the real estate market begins anew. About the time the first day a short sleeved shirt seems appropriate, the pressure to decide whether to buy a home (or sell one) rises and everyone in the marketplace begins to look for clues about what pricing will do this year. Soon, the buyers and sellers begin their oft-repeated mating ritual where each side tries to figure out how much, if at all, the pricing has advanced from last year.
The Multiple Listing Services (MLS) is the primary resource for housing information. It records 95%+ of the residential transactions that occur in our marketplace and in doing so, gives us tremendous insight into how buyers valued properties. That said, the transactions recorded by MLS have by their very nature occurred in the past and thus offer only a partial view of the future.
Looking into future in any industry is of great value. It sure would be great if we could predict the future of real estate market, wouldn’t it?
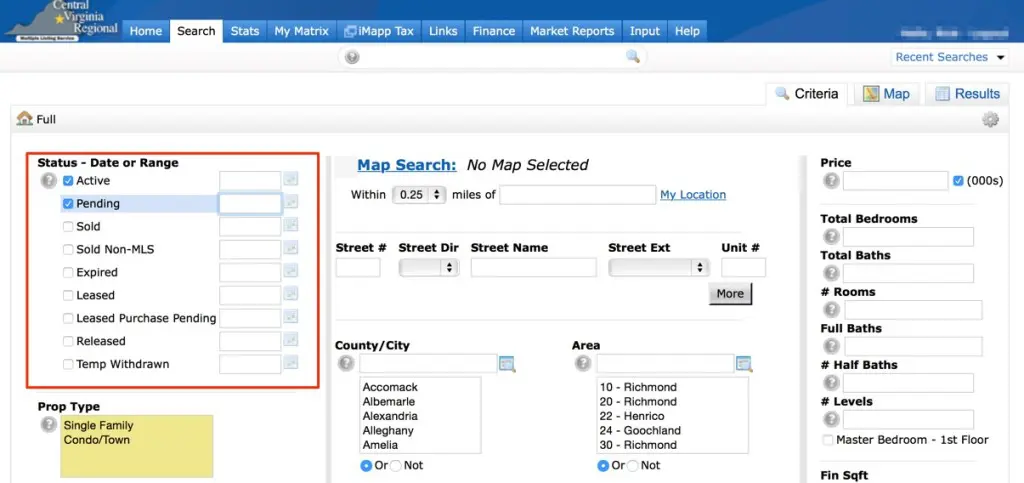
Understanding MLS Statuses
While MLS allows for 9 different statuses which describe the availability of a specific property, there are generally 3 that matter most – ACTIVE, PENDING and SOLD.
- ACTIVE means the property is currently available FOR SALE
- PENDING means the property is UNDER CONTRACT between buyer and seller with agreed upon price and terms but has not transferred. The terms of the sale are not public knowledge
- SOLD means the property has TRANSFERRED and the price and terms are now public knowledge

The key difference is that the pending sale terms are not fully disclosed until the property closes. So, in theory, little real intel can be gathered from a pending sale until it officially closes usually 45 – 90 days from the date it went under contract.
Or can it…
Sales are Seasonal
The seasonality of real estate is undeniable.
Each spring, the rate at which housing is absorbed begins to rise and continues to rise until reaching its peak sometime in the June/July time frame. In most years, the number of sales recorded from January to June will represent roughly 60% of the sales of the entire year. Furthermore, the 4 month period of March through June typically yields 40% or more of the entire year’s sales.
So, a large majority of the housing decisions made during the year are being made without the benefit of knowing the details of the sales in PENDING status. But that does not mean that we cannot make some educated guesses.
What We Can Tell
In MLS, the only information that is entered when the status changes from active to pending is which agent sold it and on what day the contract was accepted. So when the property pends, the number of days the property was marketed freezes allowing us to look at how long it took for the property to sell. This statistic is called ‘Days on Market’ and measures the time between when the property was brought to the market and when it went under contract.
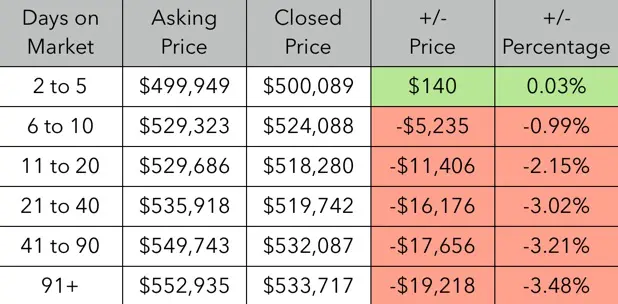
As one would expect, there is a correlation between the number of days it took the property to sell and the percentage of the asking price the seller received. Using the last 12 months of sales between $400k and 800k in the Greater Richmond Metropolitan Region, you can see a trend develop:
The obvious conclusion is that the longer the amount of time the property spends on the market, the bigger discount a seller is forced to take.
Applying the Data
In a nutshell, if you are trying to look at MLS in March for guidance, you are not going to find many closed sales from the current year … they just haven’t happened yet. Being able to draw insight from the most current available data (the PENDING inventory) is incredibly helpful in creating winning strategies. Using the chart above to guide your offer (or counter-offer) will help you understand the probable prices at which key sales will close.


