• Skip to primary navigation
  • Skip to main content
  • Skip to primary sidebar

Sarah Jarvis Team at One South Realty

at One South Realty

  • Search MLS
  • Stats
  • Deals!
  • About Us
    • The Team
    • Testimonial
    • 5 Things I Tell My Clients
  • Calling Policy
  • The Blog
  • Show Search
Hide Search

Listing

It’s (Still) All About Inventory

July 16, 2022 By Rick Jarvis

For those of you who know me, I don’t think the following will come as a surprise to anyone:

  • I follow a lot of bloggers 
  • I read a lot of articles 
  • I listen to a lot of podcasts

The bottom line is that I spend considerable time nearly every day consuming information on all things real estate. 

And in my time researching the market, I have come to one irrefutable conclusion. 

If you only want to follow one metric to understand how your market is doing, follow ‘inventory.’

Inventory is a Calculation

Now, when I say ‘inventory,’ I am using the term in a very specific way. 

Inventory, when used in real estate, refers to a specifically calculated metric that effectively measures the ratio of buyers to sellers.

Why is it so important? Two reasons:

  • Inventory measures the market currently, unlike closed sales which measure the market 45-90 days in arrears
  • Inventory is strongly correlated with price movements and can be used to forecast price appreciation –– but more on that in a moment

Definition

Inventory is defined as follows: it is the ratio of ACTIVE homes for sale relative to the number of homes that have been ABSORBED (gone under contract) in the last 30 days. The measurement is stated in terms of ‘months’ or ‘months of supply’ and answers the following question –– How long would it take us to run out of homes to buy if nothing new hit the market?

Inventory = Availability (Sellers) / Absorption (Buyers)

Example: 1,000 homes for sale / 500 homes pending in the last 30 days = 2 months of inventory. 

Make sense?

Inventory Comprises All

Inventory is the ultimate measure of any market.

Why? Because it combines all market inputs into one simple ratio.

Every input either impacts the number of buyers or the number of sellers:

  • Building costs? That is a seller side input
  • Credit scores? Buyer side
  • Interest rates? Mostly Buyer side … but interest rates can impact how many homes a builder can build, too.
  • Jobs? Buyer side.
  • Lot supply? Seller side.
  • Building codes. Seller side.
  • Rents? Buyer side.
  • School ratings? Buyer side.
  • Commutes? Buyer side.

I could go on and on, but you get the point. 

Any and all factors that impact the market manifest themselves in the inventory calculation by either creating more or fewer buyers or sellers.

Inventory and Appreciation

Robert J. Shiller - Wikipedia
Robert Shiller, Nobel Laureate

Nobel Laureate Economist Robert Shiller (and author Irrational Exuberance), has dedicated much of his work to the study of real estate.

Most real estate pros are familiar with the Case-Shiller Index, which looks at median home prices –– both nationally in the aggregate, and in 20 different metros, individually. The Case-Shiller Index, introduced in the early 90s, is considered the gold standard of home price appreciation measurements.

But in addition to the national measurement of home prices, he also created a matrix that plots inventory levels against price appreciation / depreciation.

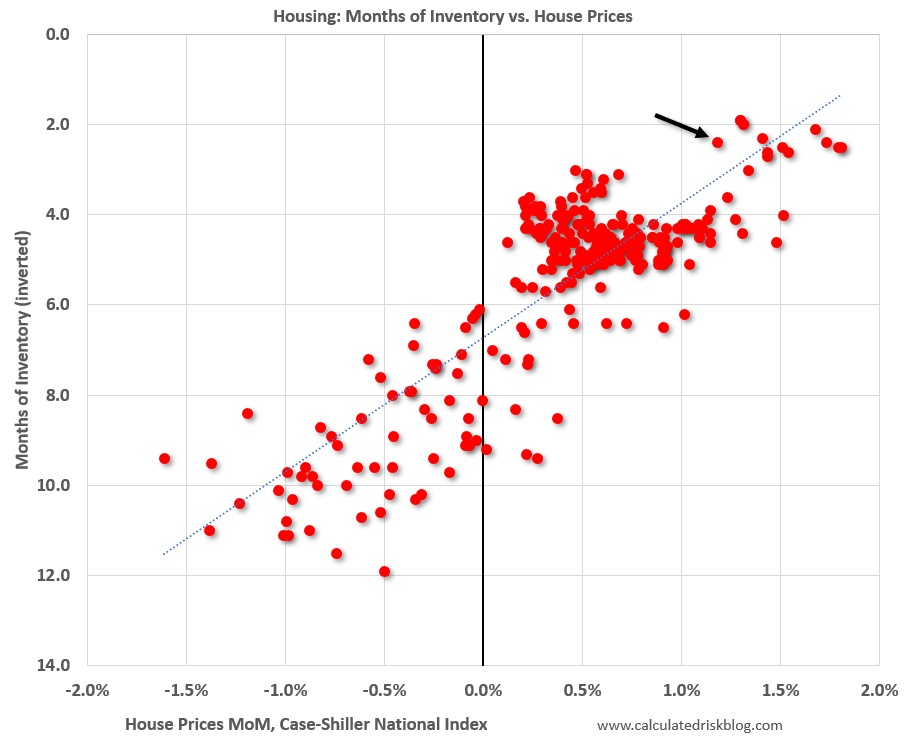
As you can see, the correlation between the two is rather obvious –– when inventory drops, prices not only rise, but by a somewhat predictable amount. And when inventory rises, price growth slows –– or even falls –– depending on how far inventory rises. 

Show me the inventory count in any market segment and I can tell you an awful lot about how that market is behaving.

Observations

A few observations jump out at me –– which I feel are critical to note as the market is changing:

  1. Housing inventory tends to hover between 3 to 5 months historically (in other words, 3 to 5 months of inventory is what most consider to be a ‘normal’ market) 
  2. Prices flip from rising to falling anywhere between 6 and 10 months
  3. At no time in history have prices fallen with inventory less than 6 months, and even have risen with as many as 8 months of inventory
  4. There are far more instances of rising prices than falling prices

Why are these observations so important to note? Because we are so far from the critical inflection points, despite what the news and other media outlets might have you believe.

So Let’s Look at Our Market

Calculating inventory is not difficult –– if you know what you are doing, it takes about 30 seconds.

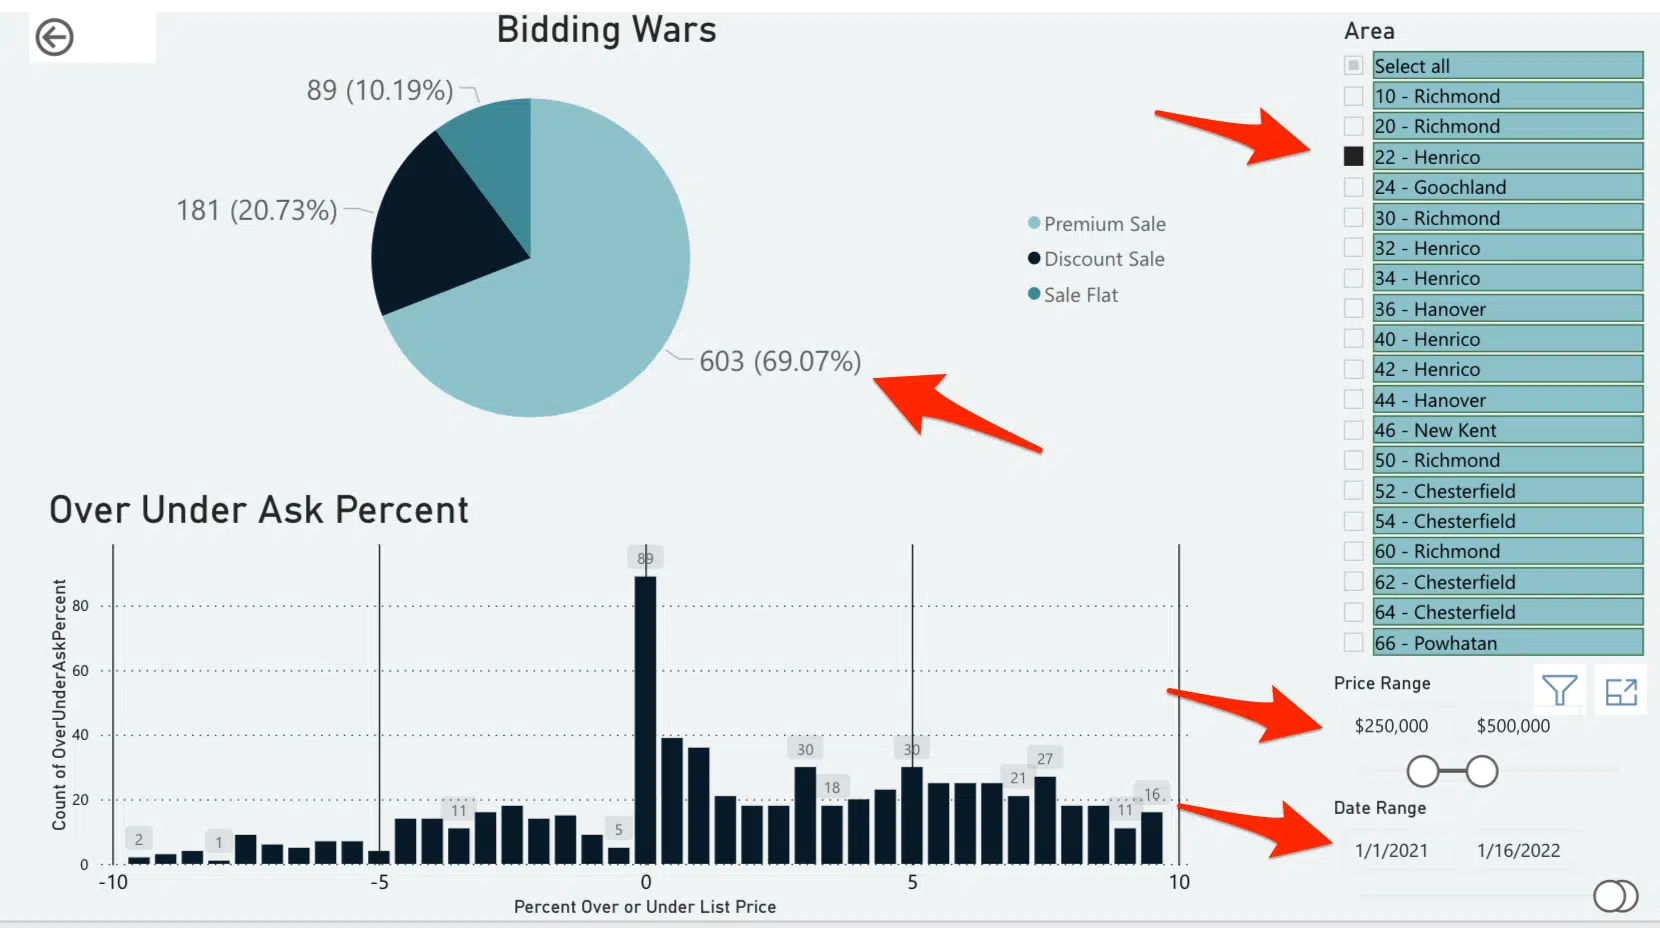
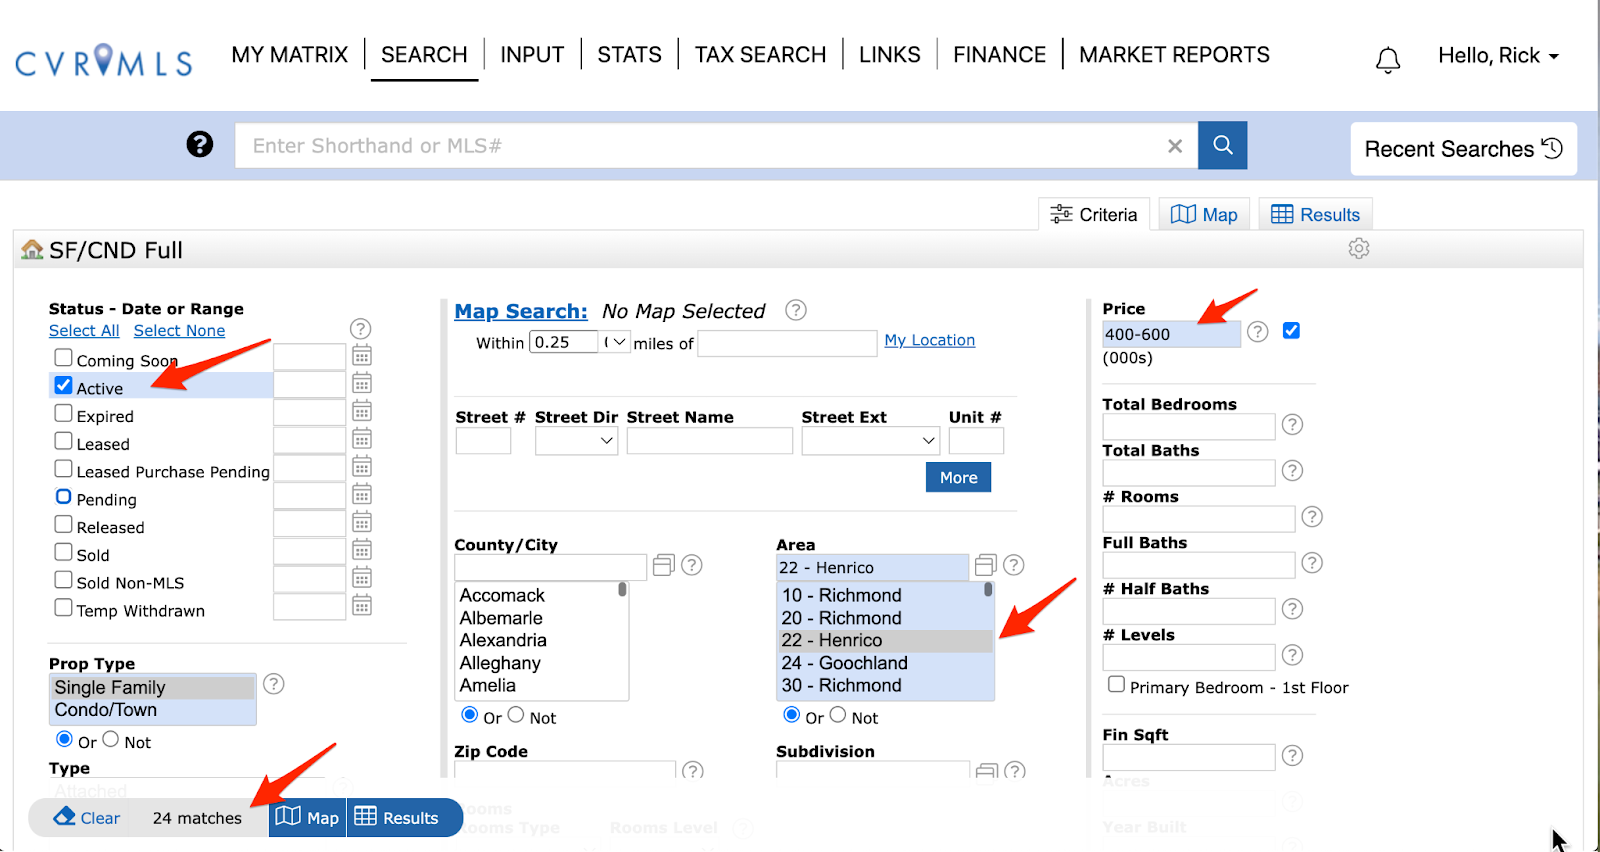
Pick a segment (say Zone 22 / Western Henrico between $400K and 600K) and count the active inventory (see screenshot below):

And then count the number of homes that have gone under contract in the past 30 days (see screenshot below):

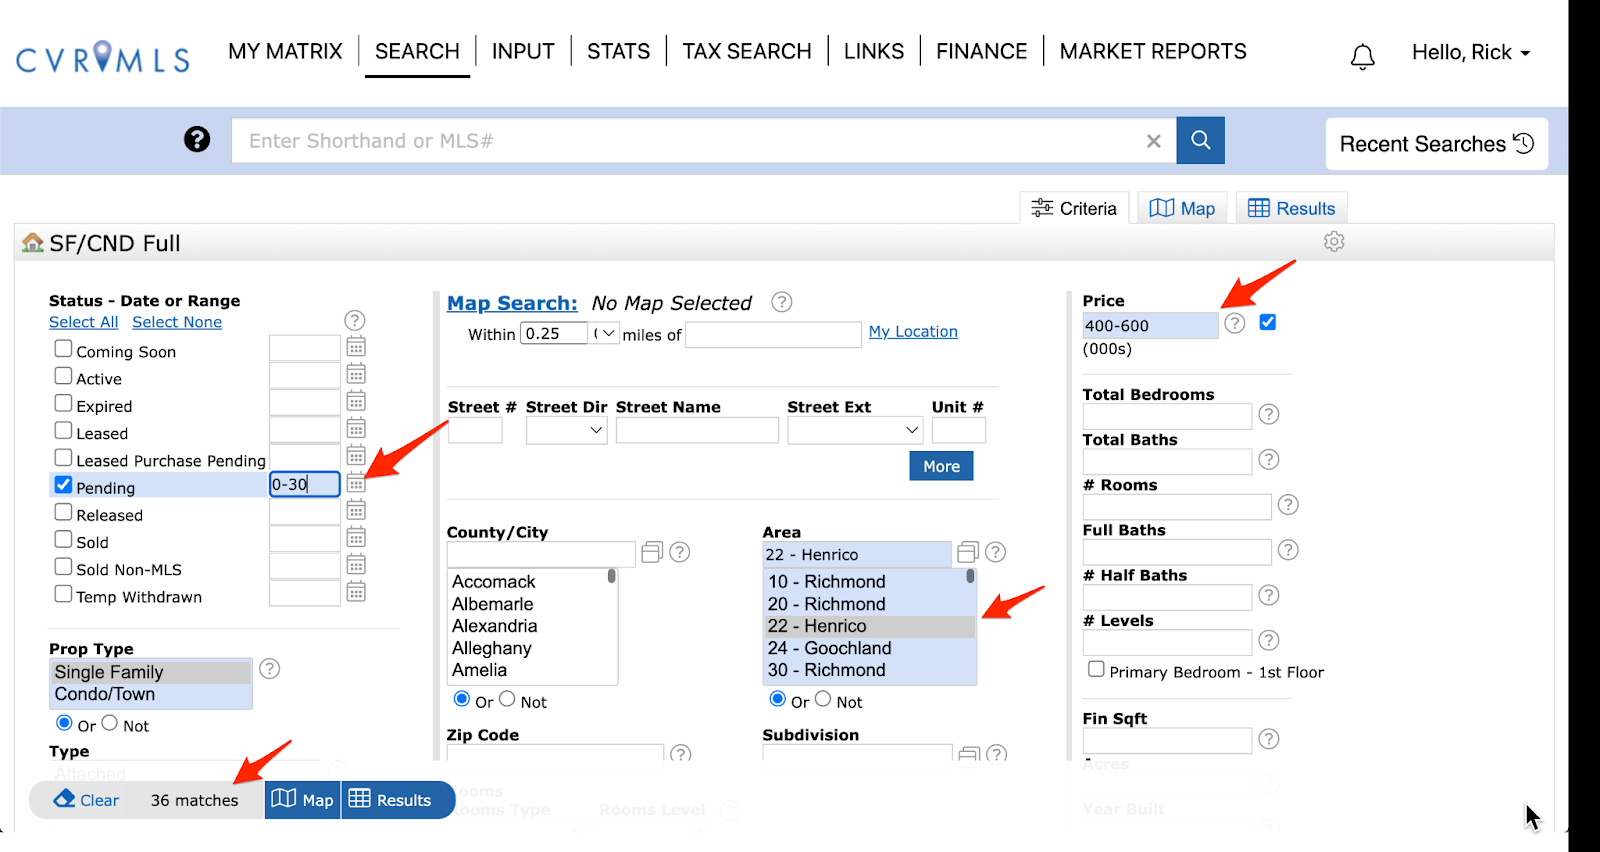
As you can see, there are currently 26 active listings and 36 homes have gone under contract in the past 30 days (I pulled the info on 7/16/22.)

26 active / 36 pending = .72 months

If you then go to the Shiller matrix, you can see that at .72 months, the expectation of appreciation is still approaching 2% per month (roughly 18 to 24% per annum.)

In other words, still quite robust.

Yeah, But…

I know the counter argument is that as rates rise, the buyer pool will shrink. Yeah, I don’t disagree, but I think the buy side of this ratio is by far and away the less important of the two. 

Right now, we have the following conditions governing our market:

  • Home building is still lagging behind demand for reasons relating to labor availability, material availability, and lot availability. The collective deficit of housing has been growing since 2011 and we are still not building enough houses to keep up with demand, much less chew into the deficit
  • Building costs have increased so quickly that realistically, it is darn near impossible to build a single family home for less than $500K –– and generally it is closer to $600K
  • All of the people who bought and refinanced their home at 2.5 to 3% are now far less likely to move and re-enter the market with a mortgage rate in the upper 5s to 6% –– meaning the excess inventory needed to push down prices will not likely come from the resale side
  • Investors have accumulated a tremendous number of median priced / affordable homes and are similarly unlikely to bring them to market with rents rising at the pace they are
  • The least risky form of construction is to build apartments or other multi-family rentals, and many large homebuilders have already begun to shift their focus to building ‘for rent,’ further depressing single family detached construction

And thus, the likelihood of an inventory spike (think 2008) is extremely low and will remain low for the foreseeable future. Building isn’t going to provide the solution and now resales will also become far more scarce for the reasons discussed above.

As a matter of fact, I think the inventory issue is more likely to get worse than better once the market settles in and the Fed stops trying to squeeze out inflation –– but I seem to be in the minority in that opinion. I guess time will tell.

Don’t Mistake What I am Saying

Does .72 hold true for all markets? No, of course not.

Every market and every segment has its own set of dynamics.

Furthermore, just because inventory is low does not mean prices will rise at the maximum rate. If you notice on Shiller’s index, a market with 4 months of inventory can appreciate anywhere from 3% per year to closer to 12% a year, so it varies quite a bit.


Here is a sample of inventories across the RVA region:

  • Western Hanover (Zone 36) at $600K is currently 4.3 months due to several new neighborhoods where construction is prevalent
  • Downtown neighborhoods (Zone 10) at $800K is 1 month
  • Forest Hill Corridor (Zone 60) is pretty much 1 to 2 months at all price points
  • Goochland (Zone 24) at $600 / 700K is closer to 9 months, mostly due a lot of construction.

So don’t mistake this blog for saying that the market isn’t subject to adjustments, only that far more segments than not are still in extremely low inventory conditions and the ability to add new housing at scale and at affordable prices is next to impossible.

Summary

Look, it is easy to believe in the idea of that which goes up, must come down. 

But this idea of gravity and prices ignores the underlying inputs –– Millennials paying record rents are trying to become owners despite the fact that there aren’t enough houses to go around. 

Sorry, I don’t care that mortgage rates have doubled. Mortgage rates have not fixed the fundamental problem –– in some ways, the increase in mortgage rates have made the problem worse by shifting the buyer pool down the price gradient where even less housing is available, but I digress.

No, the real problem, which we are not currently seeking to solve, is that we can’t build houses fast enough or cheaply enough to satisfy the demand. The layers of regulation at all levels (federal, state, local, neighborhood) have made homebuilding an incredibly compliance-based endeavor –– and I don’t see any of the regulatory oversight of homebuilding becoming less problematic … ever.

Besides, this problem is not new. We tend to forget that housing prices were rising quickly well before COVID –– as a matter of fact, the affordability issue was easy to see coming.

How easy? We wrote this article in 2016.

So keep your eyes on not just inventory in the aggregate, but in your area and price band specifically. Odds are, unless you live in an area where new construction is prevalent, your inventory count is still 2 months or less –– meaning that your prices are in no danger whatsoever.

And to the buyers, if you are waiting for a market correction, I think you may be waiting for a while. Yes, competition has thinned to some extent, but as long as housing supply stays below demand, prices will continue to climb.

Is Your Realtor Buying Property? (Or just telling you to?)

March 1, 2022 By Rick Jarvis

I am sure you have heard a Realtor say it –– ‘It’s a great time to buy or sell real estate!’

Yeah, it is rather obnoxious.

Admittedly, I don’t like the statement either, it feels not only very self-serving, but very thoughtless. It really isn’t saying anything at all –– just a recommendation to do something –– which flies in the face of legitimate thoughtful advocacy (but I digress …)

That said, it does beg an interesting question, what is YOUR Realtor doing? Are Realtors buying right now with prices as high as they are? Are they dumping everything they own thinking the market is about to tank? Are they telling you to buy but others to sell? Are they recommending what is good for you, or for them?

The bottom line is: Does their advice match their behavior?

Let’s discuss.

The ‘Agency’ Problem

The ‘agency’ problem is basically defined as follows –– it is when the representative for an individual (Realtor, stock broker, attorney, etc.) makes money regardless of whether the deal works out for the individual represented.


​​Don’t tell me what you think, tell me what is in your portfolio.”

Nassim Taleb –– Skin in the Game

In other words, if you buy a stock, or home, or car, and the value goes down, does the representative that recommended you buy it (the agent) feel the same financial pain? If they do not, then you (probably) have an agency problem –– one where the only the client suffers from the bad advice, not the agent.

As a very much younger version of myself, I remember a sage developer once telling me that he would be more than happy to build what I said he should, provided I covered his losses if it didn’t work out. And while I was taken aback by the statement initially, I quickly came around to understand what he meant. 

If he followed my advice and I was wrong, he was the one who lost –– not me. It was simply a way of saying, ‘Put your money where your mouth is.’ 

I never forgot the lesson.

Are We Buyers or Sellers?

So it begs the question, are agents buying or selling right now? And being even more specific, are WE buying or selling right now?

The answer is, yes, we are.

Wait, what, you said ‘yes’ to both. Are you buying OR are you selling?

The answer is more specifically, yes, we are doing both.

When We Are Sellers

We are selling a few things in our portfolio for various reasons, but they are not related to an expectation of a market crash.

Our house in OBX had extraordinary sunset views.

We are doing what is best for our portfolio.

The Beach House

We recently sold a vacation home we had owned for many, many years (in full disclosure, I LOVED the place, but it was time to let it go.)

Why did we sell it? For two reasons:

  1. We had a floating rate mortgage on the home, and due to the nature of vacation (2nd) homes, refinancing the property into a fixed rate mortgage was not feasible. We saw indicators that mortgage rates we due to rise and we didn’t want the exposure to an increased mortgage payment, regardless of the appreciation potential (or sunset!)
  2. The home was due for many deferred maintenance items that would have required significant capital investment. In other words, we had some expensive repairs on the horizon that would have required a lot of cash that we did not want to lose access to.

And so we sold it –– in a weekend.

Replacement and the 1031 Exchange

We then used a 1031 tax-deferred exchange technique to shelter the gains, and then bought both an office property (near Willow Lawn) AND a single family rental home in Kilmarnock (near the River) ––  and we were able to secure long term fixed-rate financing at a very low rate. 

From a strategic standpoint, we were able to remove a poorly financed property from our portfolio (that also was extremely unpredictable in its yearly maintenance costs) and replace it with two low maintenance properties financed at a 3.1% fixed rate.

And did I mention we actually upped the cash flows at the same time?

Great outcome.

So, yes, we technically sold one property (which made us a seller) but subsequently purchased two others to replace it (which made us buyers.) And we did so to reduce the risk in our property portfolio for reasons relating to mortgage finance, cash management, and tax impact –– not for fear of a market crash.

The Family Rental

In addition to the sale / purchase referenced above, we are also considering selling a property that we had owned for years as a single family rental (it is currently under contract.) 

The reasons we are doing so have less to do with a bet on the market dropping (we will simply go and buy something else similar with the proceeds, so we are still betting on appreciation) but more for a reason related to family. The home was leased by a family member and when they moved out, it felt better for all parties involved to find a new owner. 

So the reason we are selling is not to take money off the table in fear of a market collapse, it is due to a what is best described as a ‘non-economic’ reason.

The fact that we will be purchasing a home to replace it indicates our belief.

We are Naked Buyers, Too

OK, not actually naked per se –– I mean we are also buyers even we when don’t have things to sell.

In the past few years, we have added to our portfolio, over and above replacing the properties we sell.

Specifically, we have purchased a home with each of our eldest children, and are actively seeking to purchase more for investment purposes.

What did we buy, you ask? One is located in the ‘VCU Bubble’ and will always rent well (so the downside is extremely limited,) and the other is a super cute brick cape cod in the near west end (again, location and size make it very low risk.)

And yes, just like our clients, we had to win a bidding war ($40K over ask, btw) with a waived inspection clause in order to secure it –– what is good for the goose is good for the gander, right? We get the pain and uncertainty of the process.

Why put ourselves through the pain of a bidding war and the risk of potentially buying something with a lot of repairs in a market that seems overpriced? Because we are bullish on housing and we wanted to make sure that our kids had a chance at ownership in the same way that we did when we were their age.

So, yes, we are putting our money where our mouth is and we are making the same bet with our own children that we are asking our clients to make.

Other Strategies

We are also actively seeking land to develop or properties in need of renovations.

Buying housing does not scare us.

In addition to residential property, we are also looking for small office properties where we can find ‘value-add’ opportunities such as building on more space, carving off lots for development, and / or undertaking aesthetic upgrades.

We are lucky in that we have the benefit of experience to see how all forms of properties can be improved and thus our search box is bigger than most, but we are still buyers –– regardless of the asset class.

Again, we see demand well outstripping supply for the foreseeable future and nearly all forms of ownership (especially when financed at today’s rates even though they are up 25% from last year) are still a phenomenally safe play. 

The Bet We ARE Making

So to answer the question above, are WE buying or selling? The answer is that we are only sellers when we can replace what we sell.

And when we do sell, we are selling for reasons NOT related to a market crash, but rather for other strategic reasons, and we are replacing what we sell using the 1031 tax deferred exchange provision in our tax code. 

In other words, we don’t want to relinquish property at this juncture and give up the potential appreciation on any portion of it because we see more upwards pressure on pricing than we do the opposite. 

As a matter of fact, with inventory levels hovering where they are currently, the monthly appreciation is expected to be 2-3% per month (and no, that is not a misprint.)

Furthermore, we see not just property values rising, but rental rates rising as well. 

Focus on the Facts

Regardless of the events in Eastern Europe, or the interest rates, or inflation, or COVID –– the housing stock of our country is shockingly below where it needs to be and the 20 – 40 offers per listing indicates that demand is nowhere near abating (and yes, we track the number of offers, it is a phenomenal measuring stick for market momentum.)

As a matter of fact, since the beginning of 2022, the increase in interest rates has not impacted pricing whatsoever –– despite the predictions otherwise.

Am I being myopic and ignoring market crash indicators that will become obvious after the fact? Perhaps, but having lived through 2008, I am acutely aware of the conditions that caused that market to crash last time and none of those conditions exist today. 

When your market is 5M houses undersupplied, it is hard to see how things change.

The bottom line is that we see pricing continuing to escalate, with only a soft landing and flattening when the market returns to balance sometime in 2026 or 27 if we are lucky –– not the 30% drop of 2008. The lack of inventory makes a huge adjustment highly unlikely.

So just to reiterate, my money and my mouth are in the same place –– and we lived through 2008.

Have? Have Not?

The bottom line is that property ownership is increasingly becoming the dividing line between haves and have nots.

It isn’t fair, but it is an unfortunate reality (you can read more about my opinions here.)

The policies and decisions that led us to this predicament are long standing and incredibly tough to reverse. And even if they are ever reversed, the time required to build enough homes to satiate the demand is well over the horizon –– especially at the market’s entry price points. 

Housing has never really been, nor should it ever be, a short term thing –– like 1,000 shares of Apple or Bitcoin. You buy housing to own it for a years.

So yes, we are both buyers and strategic sellers –– but more than anything, we are owners and will continue to be so for the long haul. 

The Danger of the Unsolicited Offer

January 17, 2022 By Rick Jarvis

The phone rings –– you don’t recognize the number, so you answer.

On the other line is a Realtor, who says that they have a buyer who is interested in buying your property, and that they have a written offer in their hand. Would you consider selling it?

Well, you know that the market is good and that prices have gone up, so you engage.

‘How much?’ you ask. 

The Realtor on the other end of the phone tells you a number that is way above what you ever dreamed your home could fetch –– AND you wouldn’t have to pay a listing fee. 

You do some quick math –– sales price, back out a small commission for the agent, subtract what you owe –– and try to contain your excitement. 

You hadn’t planned on selling, but that is a pretty big number. 

You say, ‘Send it to me …’

The Money You Missed

A large chunk of money is hard to resist when offered –– especially when you aren’t expecting it –– and it can catch you off guard.

But do you know what is better than a high sales price? A HIGHER sales price with better terms. 

‘And how exactly do you propose that one turns a large payoff to an even larger one?’ you might ask.

Easy, you leverage the greatest invention in the history of mankind when it comes to housing –– the Realtor Multiple Listing Service (MLS.)

How to Harness the Power of MLS

So how exactly does MLS create value for the seller?

Simple –– it harnesses the power of the network and amplifies it to your benefit.

MLS tracks somewhere between 95% and 99% of all real estate transactions –– meaning that anyone who is serious about purchasing a home uses it as their primary mode of finding a home.

Yeah, I get it. Zillow, Trulia, Realtor.com have the same info and better user interfaces yadda yadda yadda, but guess where Zillow et al get their information? You guessed it, MLS.

So when you offer your home for sale and put it into MLS, you immediately broadcast its availability to a network of 6,000+ Realtors working with 95%+ of the buyers in your market (as well as ZIllow, Trulia, and Realtor.com, too.) 

The impact is nearly instantaneous –– everyone who needs a home comes rushing all at once to try to buy yours. 

Creating an Auction is Simple (if you know how)

If you have ever been to an auction, you’ve seen the impact.

If you only have one person who wants the item up for bid (which is rare), well it typically doesn’t get top dollar.

However, all it takes is two people vying for it –– and the price escalates quickly.

If you have three or more, you can guarantee the price will escalate well in excess of the item’s value –– and thus, the goal for any auctioneer is to tempt three or more people into a simultaneous bidding war. 

That is why sellers love (and buyers hate) auctions. Multiple buyers keep one another honest and force everyone to dig deep and pay up. 

Auctions identify the most desperate buyer and make that individual defeat everyone else to win the prize. And when there are hordes who all want the same thing, prices and terms reflect the fact that demand is well in excess of the supply.

And I have some good news –– good Realtors know to leverage MLS to create auction-like conditions. So if you know how to make MLS function as a de facto auction, you can create the most value imaginable for your selling clients. 

Unless, of course, someone sells their home without using MLS.

The Impact of Buyer Competition

When you bid at an auction for a piece of art, or maybe some other rare artifact, generally the price that is paid is the only thing that matters. 

Central Virginia Mls - Fill Online, Printable, Fillable, Blank | pdfFiller
A real estate contract dedicates one paragraph to price and another 10-15 pages to the remainder of the terms. A good listing agent knows how to shift a great deal of performance risk to the purchaser’s side.

When you sell real estate, price obviously matters, but so does the structure of the financing, amounts of the deposits, the terms of the inspections, the terms of the appraisal, any rent backs or other extended possession agreements, closing dates, personal property, etc. –– all of which create seller value over and above the price. 

So, while the competition will drive the price up, a shrewd seller (or more specifically, their agent) will leverage the competitive environment to simultaneously shift the remainder of the contract’s terms in favor of the seller. 

Examples 

An offer that is bid up to say, 10% over the asking price, but with an appraisal contingency that could bring the price back down if the appraisal is less than sales price, then the seller is at risk for the price to be reduced in the event of a low appraisal (happens all the time, by the way.)

An appraisal contingency is a contractual right the purchaser wants to maintain in any offer. However, if a competitive offer waives the appraisal contingency, it forces everyone’s hand and you typically see other offers follow suit.  

Similarly, if the purchaser offers a $10,000 deposit that returns to the purchaser in the event that their loan is denied, but someone else makes the deposit non-refundable, well the seller is in a far stronger position to leverage both offers to make the deposit non-refundable. 

When the seller has leverage, nearly all risk in the contract can be shifted from the seller to the purchaser.

Without multiple offers, the seller’s position isn’t nearly as strong.

Multi-Offer is Key

When you fail to expose a home to the market, you don’t allow competition to do its job.

In 2021, nearly 60% of the homes in all of our MLS received multiple offers –– an all time high. But, when you dig deeper and examine specific segments where inventory is especially low and demand is especially high, such as the affordable segment in Richmond’s West End, the number is even higher. 

Not only did 70% of the West End’s affordable homes sell for more than ask in 2021, look how far above the asking price they sold for …

So, when you cut a side deal with a tenant in your rental, or with your neighbor who has always coveted your private back yard, or you accept the unsolicited offer brought to you by an agent with ‘cash buyers from NY,’ you are squandering the leverage an MLS-inspired ‘auction’ creates to not only drive the price higher, but to shift the remainder of the terms well in your favor.

The bottom line is when buyers compete, sellers win. 

Summary

I fully acknowledge that sometimes taking an unsolicited offer or off-market sale makes sense, but the cases are far fewer than people would believe. The public just doesn’t understand the power they are giving up when they don’t let the world know that they are willing to sell. 

If you get an offer on your home but have not exposed it to MLS, please resist the urge to sell it –– even if you feel the price exceeds your expectation. You are leaving significant value on the table. 

Yes, saving some commission dollars may seem like a good idea, but I can guarantee you that the commission you save pales in comparison to the leverage you forfeit by not selling through the MLS in such an inventory-starved environment.

Perhaps in the future, when the market balances itself again, the ability to create a bidding war will subside and the commission you might save could make a back channel sale makes sense.

Today, however, is not that day. 

Context, Perspective, and Relative Values

April 13, 2021 By Rick Jarvis

What if I told you that it was going to be 72 degrees today in Richmond, would that give you a sense of what to expect when you walked outside? Of course, it would. You’ve been experiencing temperatures your whole life.

(scroll down to the end of the post to see the visualizations!)

What if I told you that it was going to be a ‘typical spring day in Richmond,’ would you know what to wear? If you have been in RVA for a spring or two then, yes, you would have a decent idea of what to expect.


Click to watch a quick tutorial of the Bidding War visualization

But what if I told you that it was going to be 22 degrees Celsius? Unless you had spent time in Europe (or maybe as a meteorologist,) then you might not know what to wear, would you?

You get the picture. Without context or experience, it becomes difficult to understand the relative meaning of anything.

Real Estate Context

So what if I told you that the inventory levels are currently at ‘one month’? Do you really know what that means?

Or what if I told you that the ‘median days on market’ is now 7? Or that the ’10 Year is at 1.7′?

Does those stats mean anything to you? Are they good? Bad? Has it changed?

Unless you are in the business, you probably don’t realize the significance of those measurements.

I think anyone who even remotely pays attention to real estate knows that the market is ‘hot’ and inventory is ‘low,’ but without having an anchoring point, (i.e.–– CONTEXT) does knowing that there are 397 resale single family homes available right now really overly helpful?

Not without something to compare it to. 

Data Visualization is Key

As agents, we tend to assume that the public knows as much about the history of the market as we do.

For any agent who has been a part of the market for any period of time, they know what 2020 felt like, and 2019, and 2018 (and so on). But if you are a first-time buyer, or haven’t bought or sold in a decade, you probably don’t have a great feel for how much things have changed.

What seems so familiar to us as agents just isn’t nearly as so to our clients –– and thus the disconnect when it comes time to put in an offer, or choose the correct price when listing. Our clients just don’t have a sense of how much things have changed or how extreme the conditions have become.

So we decided to do something about it.

The Tools You Need

MLS has tons and tons of great information –– but it just isn’t designed to be a data visualization platform.

So we took matters in our own hands.

To better help our clients gain market perspective, we created a series of customizable digital visualizations that show not just the current market conditions, but allows us to travel back in time to see how much things have changed. 

Furthermore, since even within markets, conditions can vary greatly from one side of town to another or from the upper end to the entry price points, our tools allow you to compare different areas and different price bands within our Metro to one another to gain perspective.

Happy visualizing!


#1 | Bidding Wars

The following visualization shows the number of sales that have occurred at, above, and below the asking price for any given period and MLS zone. It also shows the distribution of the sales so that you can gain a sense for how far above and below the accepted offers tend to be.

This tool is helpful for both buyers AND sellers in determining the best strategy in any transaction.


#2 | Availability Matrix

The availability matrix shows by the number of properties available by both MLS and $100K price range in order to gain a sense of how many opportunities exist in each area.

Note that you can toggle on/off townhomes, condos, and new homes in order to better understand the choices in each sub-area.


#3 | Months of Inventory

Inventory is a commonly used index to measure the housing supply.

It is dervied by looking at the previous period’s sales and dividing into the current number of available homes. If a 200 homes sold in the past 30 days, and the current number of available homes was 600, then there would be 3 months of inventory (200/600 = 3).

A market is said to be balanced if there is 5-7 months of inventory. Anything less is considered to be a ‘Seller’s Market.’ Anything more is considered to be a ‘Buyer’s Market.’

Summary

Yes, we actually have few others, too –– and even more on the way.

And of course, if there is anything that you would like to see, let us know and we will try to create the visualization for you!

When Are Home Prices Headed Down? (and other questions about the 2021 market)

December 27, 2020 By Rick Jarvis

The question was posed to me the other day and (in so many words) it went a little something like this –– ‘When do you think that prices will start to come back down for housing? I mean, they can’t go up forever. Especially not at this rate, can they??’

For any of you who follow the blog, you know that I can’t answer questions with simple ‘yes’ or ‘no’ type answers –– especially when taking on such a big question.

Sorry, I am just not wired that way.

Besides, a question that important deserves more than a one-word answer –– and so the first blog of 2021 will tackle the pricing question, if for no other reason than it is really important to understand where the market stands and what it means to each of us.

Why Even Ask the Question?

Do you realize that up until 2008, we never asked about housing prices going down?

Why? BECAUSE THEY HADN’T GONE DOWN IN 80 YEARS.

The last time that house prices fell nationwide was during the Great Depression of the 1930’s. That’s right, it took a global depression for house prices to fall.


Disclaimer –– ok, it can be argued that in 1990 / 1991, we had a very small fall in the median home price in the period following the 1987 stock market crash, but it was like maybe 2-3% at most, it was over in 18 months, and the price adjustments were more regional than national. When I say that prices have not gone down in nearly a century, I am referring to a dramatic and tangible adjustment in prices like what happened in 2008.

So just to recap –– for the better part of 80 years, home prices in the United States have marched relentlessly forward regardless of market conditions, economic malaise and / or other upheavals:

  • In 1963, John F Kennedy was assassinated in Dallas –– and home prices kept moving up
  • In 1973, when interest rates AND unemployment rose simultaneously (remember ‘Stagflation’?) AND WE HAD A PRESIDENT RESIGN –– prices kept advancing
  • In 1980, when mortgage rates were 17% and oil was $123 / barrel AND MOUNT ST HELENS ERUPTED –– home prices still rose
  • In 1986, the Chernobyl nuclear facility blew up and sent a radioactive cloud over Europe and the world –– and house prices didn’t notice
  • In October of 1987, when the stock market fell more in one day than on any other day in history while the Savings and Loan industry was in the process of imploding –– home prices were flat for a year or two and then began to rise again soon thereafter
  • In 1991, when Saddam Hussein invaded Kuwait and dared the rest of the world to do anything about it (and the world took him up on that request) –– house prices rose
  • In 2000, when the internet bubble burst and the NASDAQ lost 76% of its value in less than 6 months –– not even home prices in Silicon Valley were impacted
  • And in 2001, when terrorists hijacked planes and knocked down the two most important buildings in the most important financial district in the most important city –– home prices continued to rise

Notice a pattern?

Mortgage Fraud and the Financial Crisis

It wasn’t until the Financial Crisis of 2008 that we learned that housing prices are capable of going down. But it took a unique combination of factors –– the most significant of which was absolute and complete mortgage fraud orchestrated by Wall Street to exploit the people of Main Street –– in order to accomplish what no other economic events could.

And it is the fallout from that fraud and the subsequent news and headlines in the period following the Financial Crisis that drives so much of the suspicion about the housing market we are currently experiencing. 

Let’s examine the reasons.

Supply and Demand

Albert Einstein is credited with saying that, ‘everything should be made as simple as possible, but not simpler.’ 

I happen to agree.

The simplest way to look at any market is through the lens of supply and demand. Not to rehash Econ 101, but when demand exceeds supply, prices tend to rise –– and when supply exceeds, demand, prices tend to fall.

We know this.

And so in honor of Albert Einstein’s mandate for simplicity, we can agree that in order for home prices to come down, we would need to have either:

  • Demand for housing dry up, or
  • Supply of housing skyrocket

Let’s look at the possibility of each.

Demand Destruction

So what could cause people’s demand for buying home to dry up? Well, many things could (in theory) cause the number of buyers to drop but let’s first look at the extreme events that didn’t cause buyer demand to drop to such a rate that prices fell:

  • Marginal tax rates as high as 90% in the 1950s didn’t (and no, not a misprint)
  • The 17% mortgage rates in 1980 didn’t
  • Recessions in 1973, 1980, 1991, and 2003 didn’t
  • The Cuban Missle Crisis, the Cold War, Korea, Vietnam, Iraq 1 and 2, and Afghanistan didn’t
  • Even a COVID-driven worldwide shutdown didn’t
Wait, did you say 90% tax rates??? Yup.

So what did finally cause buyers to go away?

Fraud.

When Wall Street hijacked mortgage lending and started giving out loans to anyone who asked regardless of their ability to repay, and then sold those loans with false stamps of AAA ratings to any investor stupid enough to buy them, the fallout was a 5 year reset where prices fell by as much as half, depending on your market and housing type. 

And even then it was not necessarily the lack of buyers ––  but the lack of credit –– that did the market in. In what seemed like a day, credit markets swung from ‘anyone can get a loan’ to ‘no one can get a loan.’

No credit (loans) > no buyers > no demand > prices crash > foreclosure > prices crash more. Repeat…

The sub-prime lending debacle that led up to the banking / financial crisis of 2008 was the largest sustained period of fraud in the history of the US.

Simply put, only an industrial level of fraud at the highest level of the financial markets, combined with regulatory agencies that were either complicit or asleep at the wheel (or both), was able to meaningfully derail the housing market.

So nearly a century of modern history has shown that if you don’t monkey with mortgage underwriting, the housing market tends to remain remarkably stable year over year ––  despite all other political or economic conditions.

What Drives Demand for Housing?

This is a far more subjective question than an objective one, but two basic reasons exist why people want to own housing –– and have wanted to own it since the dawn of time: 

  • Houisng provides stability
  • Housing is a ‘safe’ investment

The Need for Stability

While I think we all enjoy traveling from time to time and seeing new places or visiting family and friends, the feeling of arriving back home to YOUR sofa and YOUR controller and YOUR coffee maker just feels right.

With a few exceptions, we are not an innately nomadic species, and thus we like to have a place we call home. 

Don’t believe me, ask Abraham Maslow. 

Maslow's Hierarchy of Needs | Simply Psychology

Maslow’s famed Hierarchy of Needs (above) asserts that there is no way to reach the pinnacle of the pyramid (Self-Actualization) without our most basic needs being met. And if you read the words describing each level –– shelter, property, connection, status –– it smacks of housing.

The need we all feel to have a home base, a center, a domicile, a way to express ourselves, and a place that no one can take from us is powerful –– and all financial arguments aside, these are fundamental human instincts and at the core of why we crave a place to call home.

A Smart Investment

So, not only does owning a home make us feel good, it is financially prudent.

As it is often said, the only guarantees in life are death and taxes. I think they need to add one more –– rent (or mortgage.)

The bottom line is that living with a roof over your head requires an investment by whoever resides there. 

So, if you have to pay someone to live somewhere, wouldn’t you rather pay yourself? Well that is what ownership does. 

This becomes especially true when you realize how little the difference between a typical rent payment and a typical mortgage payment actually are:

  • Average rent payments in 2020 were nearly $1,500 per month
  • The median mortgage payment in 2020 was $1,500 per month
Statistic: Average monthly apartment rent in the United States from September 2016 to February 2020 (in U.S. dollars) | Statista

That fact alone should make you want to own, but there are more:

  • Beneficial tax treatment on many levels
  • Additional legal protections
  • The ability to use leverage to acquire it
  • Subsidized borrowing (government-backed mortgage rates and extended terms)

Besides, you have to live somewhere, right? I mean, have you ever tried to live in your 401k? Ever had your buddies over to watch the game in the basement of your IRA? Ever taken a nap on your mutual fund? You get the picture.

Housing is the only appreciating asset that I know of that provides basic human needs.

And not to wrap myself in the flag here, but I also think that we tend to forget that homeownership (ok, the right to own property) is one of the fundamental rights provided by our Constitution –– and many people on this planet are denied the privilege of ever owning property.

Yes, we can always satisfy our housing needs by renting a place, and yes, sometimes renting even makes sense. But on the whole, homeownership is not a concept Hallmark invented to sell more cards –– owning a home helps fulfill the human desire for refuge and stability.

Show me a stable country, and I’ll show you one where property rights are fundamental rights.

So, when you see pricing of the typical home inch up every year DESPITE every conceivable economic headwind possible, it should tell you something about the need we all feel to secure our future and provide for ourselves and our loved ones. 

Supply 

So if housing feeds our inner caveman and we can’t destroy demand despite recessions, stagflation, oil prices, wars, and/or COVID, maybe the supply of homes will spike and the excess number of homes for sale will push prices down??

Its possible –– but just not likely.

In order for someone to purchase a home one of two things need to happen –– someone needs to offer an existing house for sale OR a builder needs to construct a new one. 

Let’s look at each.

Resale Homes

In what is a bit surprising, the percentage of the population that moves in any given year has been on the decline –– and this is a long term trend (and honestly, I did not know this.)

Beginning in the 1950s, the percentage of people that move (migrate) has fallen sharply –– from roughly 20% of the population in any given year to now less than 10%. Technology and other factors seem to be the most likely culprit (in an information economy we don’t need to live where the jobs are in the same way we did in the manufacturing economy of prior eras) and thus the market for resale homes was under systemic pressure well before the inventory woes of today. 

Inventory Woes

So needless to say, the supply of resale homes has been on the decline for a considerable amount of time and feels unlikely to undergo such a change that could cause it to dramatically shift in the other direction.

Why do I say that? Because where are you going to go? The market in which you sell is the market in which you purchase and when inventory is as low as it is now, it is only human nature to stay put since finding the next home is no guarantee.

Ask any agent who has been an agent for any length of time and they will tell you that inventory levels have been under pressure and in decline ever since we began the recovery in the latter part of 2012.

At first, the fast-approaching lack of inventory was not apparent as we had an overhang of overbuilt homes that needed to be absorbed and a buying public that was still reluctant to hop back in the game. 

But sometime around 2015, the number of sales began to recover to pre-bubble norms and houses started to get absorbed, and absorbed quickly. Marketing times began to drop sharply and the discounts sellers had to take to get a home sold also began to tighten.

It was at this point that we began to build new homes in earnest in order to … pick … up … the … uhhh … slack … wait, nevermind.

New Homes

Perhaps the most impacted segment of any market in the wake of the Financial Crisis was homebuilding.

From March of 2006 to March of 2009, the US went from building more homes than it ever had (2.2M per year) to building fewer (478K per year) than at any point in the last 60 years. 

That is 78% less, if you are scoring at home. 

And for the most part, homebuilding has never recovered. 

Not Enough New Homes

Most economists agree that the US needs something on the order of 1.5M new homes a year to keep pace with population growth.

The US finally surpassed the 1.5M new home start level in December of 2019 for the first time since late 2006 (14 years!) and then COVID hit. The new home momentum we were finally beginning to see withered quickly in the face of the COVID uncertainty.

Due to the 14-year long rate of undersupply of new homes, several studies peg the current new housing deficit in the US at somewhere between 3M and 4M homes. 

So to summarize, home building is at least 3M homes (if not closer to 4M) below where it needs to be. Even in its good years, the building community was only able to create 500K to 600K more homes than were required to keep pace with natural demand. 

Stated differently, if we can max out the homebuilding industry to 2.2M homes again (which is about 700K over the 1.5M yearly demand), it would take us 5 years to erase the 3M to 4M deficit. 

Given the fact that we can’t overproduce housing easily AND the long term trend is to NOT relocate, the bottom line is that a supply-side crash is extremely unlikely. 

So What Could Sink the Market?

It is a great question, and I honestly don’t know –– because massive fraud is the only event in the last 90 years that did.

Think about it –– in less than one year, we experienced COVID, massive civil unrest in the wake of the killing of George Floyd, and the most contentious election on record –– and real estate values WENT UP!

Wait, what?!? Up?!?

So in a weird way, that seems comforting.

Other Risks

But if pressed, below is a list of the other risk factors that could (ok, should) have an impact on the housing market:

  • COVID Behavioral Shifts –– The behavioral shifts brought on by COVID have caused a disproportionate number of people to exit large markets and land in 2nd and 3rd tier cities and/or suburbs. Why live in a 300 SF apartment in NYC for $3K/mo when you can live in the ‘burbs and use Zoom? This is causing some regional price adjustments in both directions.
  • Forbearance –– The pending foreclosure spike due to the end of the forbearance protection period will rear its ugly head soon. That said, there has never been more equity in housing (meaning sellers will sell their home versus allowing foreclosure) and any foreclosed properties will likely be absorbed quickly by a starving buyer pool.
  • Reform Fannie + Freddie –– The potential for DC to enact legislation that impacts the way we underwrite loans and / or restructuring of Fannie Mae and Freddie Mac is always an issue. For years, DC has threatened to remove the implied guarantees from Fannie and Freddie which could shorten the duration of mortgages (say from 30 years to 10 or 15) and probably cause mortgage rates to jump. In this tender of a market, I just can’t see DC doing anything that could injure housing –– but logic has never stopped DC from making a dumb decision at a poor time, has it?
  • The Deficit –– The dramatic increase in the Federal deficit and the pending tax burden we will all have to bear will have an impact on our pocketbooks for sure. COVID has been hugely expensive, but don’t forget that over the last 30 years, we have fought three hugely expensive wars and are committed to massive unfunded entitlements that date back to FDR. The Federal Government was carrying a huge debt load before COVID, and the final bill is not as of yet known. Higher taxes never help an economy, but they are on the way.
  • Mandates / Regulation / Compliance –– Policy mandates that have dramatically increased the cost of building new homes. Yes, the Chesapeake Bay is important, and so are other green initiatives, but you can’t force the entire burden onto builders and developers and then complain about the price of a new home. Studies show that up to 25% of the cost of a new home is in regulation and compliance –– and that is before the impact fees extracted at the local level by the counties and cities. The bottom line is that cost gets passed on to the consumer.
  • Materials –– The cost of construction materials has gone through the roof. Some cost increases are due to the interruption in the supply chain due to COVID, but long term costs are trending higher. When you combine material increases with the compliance expense (above), you can’t build a decent house for less than $400K (or more.) Affordability has become a ‘forever’ issue in my opinion.
  • Demographics / Demography–– Demographics in the US are working in our favor for sure. The Millennials are entering the market in force and will help support all forms of consumption –– especially housing. And despite what seems like insurmountable problems and systemic differences, the US is still the best place on the planet to live and thus we will always have an immigration waiting list. Positive population growth is important and an ample workforce even more so. That is an insurance policy few other countries have at their disposal.
  • Affordability –– Affordability issues are about to rear their ugly head, too. Home prices are rising quickly, but incomes are not rising at anywhere close to the same pace. You can’t continue to have price increases beyond the ability for someone to afford it. This is especially true at the entry point of the market. Stay tuned…
  • Mortgage Rates –– Yes, the mortgage rates are in the 2s and 3s. And yes, in 1980 they were 17% –– so higher rates are not necessarily the killer most assume them to be. But only a very small slice of the home buying world remembers even the 7% rates of the early 2000s and thus when rates start to climb (and they will at some point) it will be interesting to see what happens.

Each of those factors can potentially have an impact, but other than the likelihood that DC will fundamentally shift how mortgages are issued, I don’t see a single threat on the horizon that could cause a fallout on the scale of what happened in 2008.

DC, The Federal Reserve and Falling Home Prices

And I think this is key –– while not only does the average consumer remember the housing crash of 2008, so does almost every senator, congressman, and financial regulator –– and trust me when I say this –– THEY DON’T WANT TO SEE IT HAPPEN AGAIN.

4 Ways an Economy Can Deleverage: Ray Dalio Explains

When prices fall, it sets off a series of events that spiral downward quickly. Just because the price of your home drops, the debt does not, and when debt levels are higher than the price of the home, foreclosure starts to become common. Large numbers of foreclosures tend to lead to prices falling even more, which leads to more foreclosures, which leads to even lower prices … you get the picture.

The official economic term for a declining cycle of pricing is ‘deleveraging‘ and it is vicious, indiscriminate, ugly, and thoroughly painful.

No one –– I repeat, NO ONE –– wants to see that happen again.

Summary

Yes, I am sure that regional pullbacks are entirely possible, especially in the areas where economic losses are greater (Las Vegas or Orlando for example) or where a shift in employee behavior is permanent (Zoom and its impact NYC / SF) –– but those losses are likely to abate once the vaccine becomes available and the virus is in the rearview mirror.

And could there be another financial crisis on the scale of 2008 that we don’t know about? Of course. The nature of markets –– and of life –– is that you never reeeeeeeally know what everyone is up to. Market adjustments tend to occur when we least expect them to.

But, as long as the following conditions continue:

  • The US population continues to grow
  • The supply of housing remains constrained
  • Mortgage underwriting remains constant

Then the US housing market should remain healthy and a 30% drop in prices is highly unlikely.

As a matter of fact, the likelihood of prices rising more is far greater than the chance of them pulling back, and thus the idea that waiting to purchase at a lower price several years hence is also unlikely to work in your favor.

Don’t allow the events of 2008 to cloud your vision in 2021. The conditions could not be more different.

  • Go to page 1
  • Go to page 2
  • Go to page 3
  • Interim pages omitted …
  • Go to page 10
  • Go to Next Page »

Primary Sidebar

804.201.9683


How Do I Schedule a Showing or Find Out More?

I am Kendall C. Kendall, Client Care Coordinator for the team. I am a licensed Realtor and it is my job to answer questions and schedule showings for the properties shown on our sites. Here's our call policy.

kendall@richmondrelocation.net

Working With Buyers

I am Sarah Jarvis, Broker at One South and I work with our buyers. I bring 20+ years of experience to our Buyers Advocacy program and take great pride in helping our clients understand the RVA marketplace.

sarah@richmondrelocation.net

From the Blog

Interest Rates 101

When I got my license in 1993, interest rates were 7.5%. By the end of 1994, interest rates were approaching 9.5%. When the market really got rolling in the early 2000's, interest rates were still hovering around 8%. In 2008 (the year the market crash began in earnest,) mortgage interest rates …

[Read More...] about Interest Rates 101

More Posts from this Category

  • Facebook
  • Instagram
  • LinkedIn
  • Twitter

The Ultimate Stats Page

Ultimate Stats Page

Latest Tweets

  • It’s wise to follow mortgage rates, but don’t get to caught up nitpicking the rates, because once your locked in th… https://t.co/qLAjQT1QNf March 10, 2023 7:39 pm
  • Are you viewing a housing asset correct? ⁣ #rvahousing #rvarealtor #rvarealtors #rvahousinginsights… https://t.co/gJtuSo6Wkh March 10, 2023 7:35 pm
  • Your miscalculation could cost you. ⁣ #rvahousing #rvarealtor #rvarealtors #rvahousinginsights #onesouthrealtygroup… https://t.co/RqwoqwXaKH March 10, 2023 7:08 pm
  • Don’t lose money in real estate. Work with a trusted agent to build wealth through real estate. ⁣ #rvahousing… https://t.co/IRTHSroHBL March 10, 2023 7:05 pm
  • The market dictates pricing.⁣ ⁣⁣ #rvahousing #rvarealtor #rvarealtors #rvahousinginsights #onesouthrealtygroup… https://t.co/ArRaru8q2j March 6, 2023 8:25 pm

804.201.9683


How Do I Schedule a Showing?

I am Kendall C. Kendall, Client Care Coordinator for the team. I am a licensed Realtor and it is my job to answer questions and schedule showings for the properties shown on our sites. Here's our call policy.
kendall@richmondrelocation.net

804.305.2344


How Do I Determine What I Can Afford?

With over a decade of mortgage industry experience, Southern Trust Mortgage knows what it takes to provide the very best service for each of their clients and truly believes in forming lasting relationships with their customers.
www.southerntrust.com
Southern Trust Logo

Equal Housing

The Sarah Jarvis Team agrees to provide equal professional service without regard to the race, color, religion, sex, handicap, familial status, national origin or sexual orientation of any prospective client, customer, or of the residents of any community. Any request from a home seller, landlord, or buyer to act in a discriminatory manner will not be fulfilled.

IDX Disclaimer

All of the information displayed here is deemed to be gathered from reliable sources but no warranties, either express of implied, are made part of this site. Additionally, the IDX Feed for listing information may contain descriptions of properties not represented by One South Realty, its agents or staff and any violations or misrepresentations are the sole responsibility of the listing brokerage of the subject property in violation.

Our Network of Sites: RichmondVaNewHomes.net, RichmondVaCondos.net, RichmondLuxuryNeighborhoods.com,
RichmondFanRealEstate.net, RichmondVaMLSSearch.net
Housekeeping: Sitemap, Listings Sitemap


Members of the Sarah Jarvis team are licensed in the Commonwealth of Virginia.


Loading Comments...