2019 is going to be a transitional year.
In the same way that you might take your foot off of the gas when you see a yellow light in the distance, 2019 will likely be a year where we see some segments of the real estate market lose a bit of their momentum.
‘A Return to Normalcy’ was a phrase used by Warren Harding during his presidential campaign in the
1920’s to define the period of recovery after WWI …
For many, a slower pace will feel extremely odd. All we have known for the past 5+ seasons is rampant price increases and bidding wars. That said, 2019 is likely the year that the frothiest behaviors will subside –– at least in some segments (which we will touch on in a few paragraphs.)
In reality, what we are beginning to see is not a market in decline, but rather <gasp> the leading edge of a normal market.
Disclaimers
First, I need to disclaim a few things.
- Nothing in this post is guaranteed to happen tomorrow, or probably even the next day –– most of the observations are longer-term in nature and represent a shift in direction, but not a bootlegger’s u-turn.
- Also, recognize that an individual house value behaves differently than a set (or segment) of houses. Colors, condition, architectural style, yard, appliances –– they all matter to individual buyers and sellers and can impact the value of an individual home. But the behaviors being discussed below refer more to how groups of homes behave in the aggregate.
- And lastly, any number of unforeseen events could change things –– and fast. Politics, trade wars, real wars, oil prices, and/or natural disasters all have massive impacts on our economy as a whole. And corporate acquisitions, sales, and/or relocations can all have impacts on our region, specifically.
So with that bit of throat clearing, I proudly bring you the ‘What is Going to Happen in 2019’ prediction post (and if you want to see how I did in prior years, you can find 2018’s post here.)
A Return to Comparative Normalcy
What is normal, anyway? Well, we wrote about that very question at the end of 2018. But the takeaway is that ‘what is normal’ is more of a relative question than an absolute one.
If you asked ‘1993 Rick’ what I thought of a 5% interest rates and 5% appreciation, I would have been giddy with the excitement of how many properties we were about to sell. But when you ask ‘2019 Rick’ the same question, I think, ‘Yeah, 5% rates and 5% appreciation is sure going to be slower than the 4% rates and 10% appreciation of 2016.
The lesson –– it’s all relative.
Does Anyone Remember?
To give you an idea of what a historic version of normal will look like, imagine a market with the following metrics:
- 6 to 8% mortgage rates (instead of 3.5%)
- 3 to 4% annual appreciation (instead of 8 to 10%)
- 45 to 60 day marketing times (instead of 7 to 14 days)
- 2 to 4% seller discounts (instead of multiple buyers with escalator clauses)
You see, the period from 1990 to 2005 looked a lot different than 2005 to 2018.
If you asked 1993 me what I thought of a 5% interest rates and 5% appreciation, I would have been giddy with the excitement of how many properties we were about to sell…
And, yes, I get it that many of the inputs are different (demographics, population trends, preferences, architecture, inventory, regulation, materials), but the period of 2005 to 2018 was about as unprecedented as one could imagine.
Honestly, I think a little more stability in housing is a good thing. NASDAQ levels of volatility in housing just
Segments Matter
So in our end of the year meeting at One South, we spent a lot of time on the idea of market segments. Segmenting (stated differently) is nothing more than looking at smaller samples of how connected sales behave, and not aggregating all housing into one analysis.
Pro Tip here –– If you ask an agent, ‘How’s the market?’ and they don’t ask a qualifying statement like ‘Which segment?’ or ‘What area are you referring to?’ then you need to find a new source of your information.
In the same way that New York’s housing market behaves differently than Orlando’s, the new construction market in western Chesterfield should behave differently than Bellevue does –– and this will be key in understanding the new market.
Segments and the Impact of Population
For years, the City of Richmond’s population was in decline. Chesterfield and Henrico were experiencing explosive growth, but the City was not.
Around 2000, the City population trend officially reversed.
In the latter
When the
The Impact of Growth
For the last 5 years, extremely tight City inventory levels and incredibly competitive bidding wars (the worst we saw in 2018 was 18 offers on one house near Carytown, no joke!), especially at the lower price points, has been the norm.
What do you get when your supply is fixed and demand increases? Price appreciation, that’s what.
The growth rate within the City has not only equaled the growth rates of the surrounding
So as long as this trend continues, if you own property in the City, you are probably sitting pretty.
The Behavior of Various Segments
Now when we compare pricing for various segments, what we tend to see is the areas where pricing is the most affordable and closer to the urban core have appreciated the most dramatically. Areas that are further out and/or more highly priced are the ones where pricing has gone up at a slower rate.
Now, with all general statements, there are going to be exceptions, but overall, the statement holds true. Take a look below at 5-year appreciation rates in different areas of the Metro.
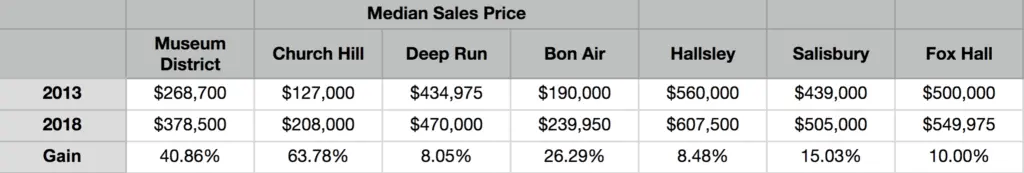
As you can see, the appreciation rate differs greatly.
Does that mean that you have made a mistake or are subject to deflation in the coming years if you live in a suburban area with new construction? Not at all. It just means that you shouldn’t expect that your neighborhood will behave the same as the one with a lower price point or on the other side of town.
And the Reasons, Please?
What do Fox Hall, the Deep Run High School District, and Hallsley all have in common? Fairly high prices to begin with and a great deal of new construction nearby.
What do the Museum District, Bon Air, and Church Hill have in common? Relative affordability and great difficulty in building new homes on any sort of scale.
Simply put, we can’t build houses where we need them most AND we can’t build them at the prices that the market can easily afford.
As we have stated many times before, the ability to provide housing is easiest where land is plentiful. So in areas south and west of Route 288, as well as points east in Henrico, where large tracts of undeveloped land are available, it is far easier to create new communities of scale.
Building is Getting Harder
But as any builder will tell you, not only are they being forced to build further away from the urban core, their costs are skyrocketing (both materials and labor) and the mandates placed on them by the counties are increasingly burdensome.
Take a look at the chart showing what has happened to the cost of construction (labor + materials). The builders aren’t lying when they tell you how much their costs have increased.
Furthermore, the arrival of several national builders is going to change the way new homes are sold in Richmond. DR Horton, Schell Brothers, and Stanley Martin each have the financial backing to build more homes in a quarter than most of the local builders could
The Return of Strategic Mortgage Decisions
Let’s shift from home prices to borrowing money.
For the better part of a decade, choosing a mortgage product has been pretty much a no-brainer:
- What mortgage product do you choose when 30-year fixed rates are at 3.5%? You take the 30-year fixed rate because of the 30-year guarantee.
- What mortgage product do you choose when 30-year fixed rates are at 4.5%? You take the 30-year fixed rate because of the 30-year guarantee.
- What mortgage product do you choose when 30-year fixed rates are at 5.0%? You probably still take the 30-year fixed rate because of the 30-year guarantee.
But what happens when 30-year fixed rates are at 6.25% but a 5 year adjustable is at 5% and you only plan on being in your home for 5 to 7 years? The question becomes trickier, doesn’t it?
Welcome to the new (ok, old) world of mortgage finance.
In the 1990’s, we saw clients make the fixed vs adjustable mortgage decision all of the time.
But since rates cracked the 5% floor in 2010, taking the risk of an adjustable mortgage seemed unnecessary.
Where are we currently? We enter into 2019 with rates hovering around the 5% mark. And while no one can claim to be a master of perfectly predicting interest rates, the majority of industry experts feel that 30-year rates between 5.3 and 5.8% (or even as high as 6%) by year’s end are a real likelihood.
So as the spring market emerges and the demand for money increases, the shrewd buyers will keep an eye on the mortgage products OTHER than the 30
At some point, the spread between fixed and adjustable mortgages may justify selecting shorter term mortgage products –– especially when the expected hold period is less than 10 years.
Cue the ARM (the Adjustable Rate Mortgage)
Wait, did you just say that ARM’s are good?!? I thought that ARM’s were the thing that caused the financial crisis in 2008?!?
Well, if you don’t underwrite an ARM properly, then yeah, an ARM is not a good product. But no mortgage is safe if it isn’t underwritten correctly –– ARM or otherwise.
So let’s not blame the ARM, let’s blame the true culprit –– shoddy underwriting.
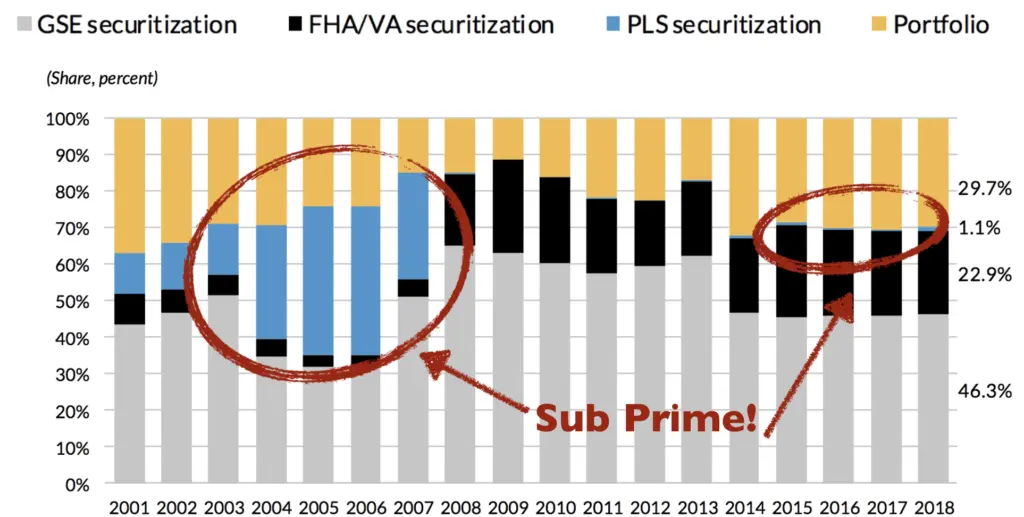
In the financial crisis of 2008, a great deal of focus of was placed on the Sub Prime mortgage industry. And there was no more abused loan product by the Sub Prime industry than the ARM.
Today’s Arms are Actually Underwritten
The difference today is that the ARMs issued by Fannie Mae, Freddie Mac, and FHA are underwritten properly and also contain caps on the adjustments so that extreme swings in interest rates do not dramatically increase the risk of default. The Sub Prime ARM’s were neither underwritten with any rigor, nor were they capped in such a way as to minimize risk. (And in many cases, they were designed to fail, but that is another topic for another day.)
As an example, a 5/5 adjustable with a 2% cap means a mortgage with a fixed rate for 5 years with a maximum adjustment of 2% at then end of year 5, with another 5 years of the new rate before another adjustment. Is that overly risky? Not when applied correctly it isn’t.
What makes an adjustable mortgage product appealing? The rates tend to be lower –– especially the higher that the 30-year fixed rate becomes.
And while the spread between fixed-rate and adjustable rate products is not quite to levels that justify the switch, it might not be too far off in the future.
So if your loan officer suggests you take a look at an ARM, don’t reject the idea simply out your memory of 2008. An ARM, like a screwdriver or a shovel, is simply a tool. When you use a tool appropriately, they tend to work quite well.
Since 1991
So we (Sarah and Rick) have been in real estate –– as agents, brokers, lenders, developers, owners, and rehabbers –– for longer than we would like to admit. And consequently, we have had front-row season tickets to the booms, several busts, and each subsequent recovery.
We have had front-row season tickets to the booms, several busts, and each subsequent recovery…
What does that mean? It means our advice is based on experience that dates back to the early 1990’s.
- In 1991, the median sales price of a home in the US was $120,000. It is now $315,600
- In January of 1991, 30 year mortgage rates were 9.56%. They are now 4.75%
- In 1991, the average rent was $649. It is now $1,450.
- In 1991, there was no Zillow and no Trulia. As a matter of a fact, there was not even an online MLS
What else does it mean? It means our team is extremely excited to see times ahead where good decisions will rule the day, and not just momentum.
- We love the fact that strategic decisions about mortgage are required, and not just blindly electing a 30-year mortgage, regardless of the situation
- We love the fact that the need to make purchase decisions under multi-offer pressure will likely subside
- And we love the fact that the data now exists to really help demonstrate the best course of action, and decisions are made based on information, not conjecture
Welcome to 2019, the leading edge of normal.