• Skip to primary navigation
  • Skip to main content
  • Skip to primary sidebar

Sarah Jarvis Team at One South Realty

at One South Realty

  • Search MLS
  • Stats
  • Deals!
  • About Us
    • The Team
    • Testimonial
    • 5 Things I Tell My Clients
  • Calling Policy
  • The Blog
  • Show Search
Hide Search

Mortgage Lending

Buy a House, Pay for College

February 4, 2018 By Rick Jarvis

Several years ago, we wrote a blog about buying a small house or condo for your child attending VCU. That article has always been popular and carried significant traffic on the web.

And Now… We Have a VCU Student!

Since the first article is now a bit outdated and we’re currently in the works of purchasing a home for our own child headed to VCU, we think now is the perfect time to take a deeper look at the concept.

First, let’s look at some pricing statistics for the past several years.

YearMedian Sales PriceMedian Price/SF
2015$187,000$147
2016$210,000$159
2017$227,000$179
2018$238,000$182
2019$255,000$191
+/- %+36%+29%

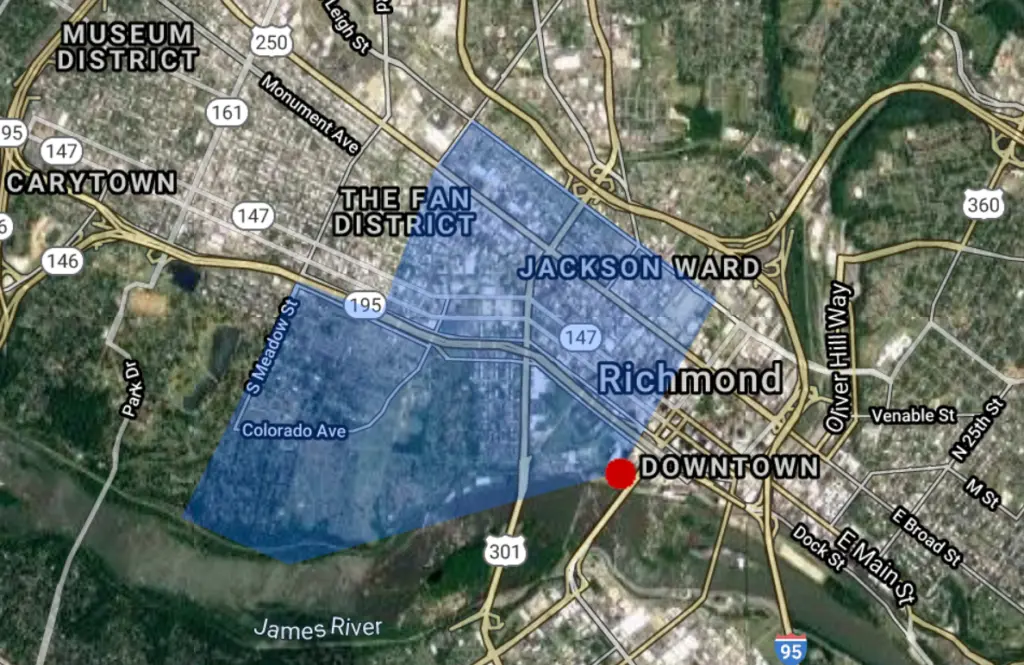
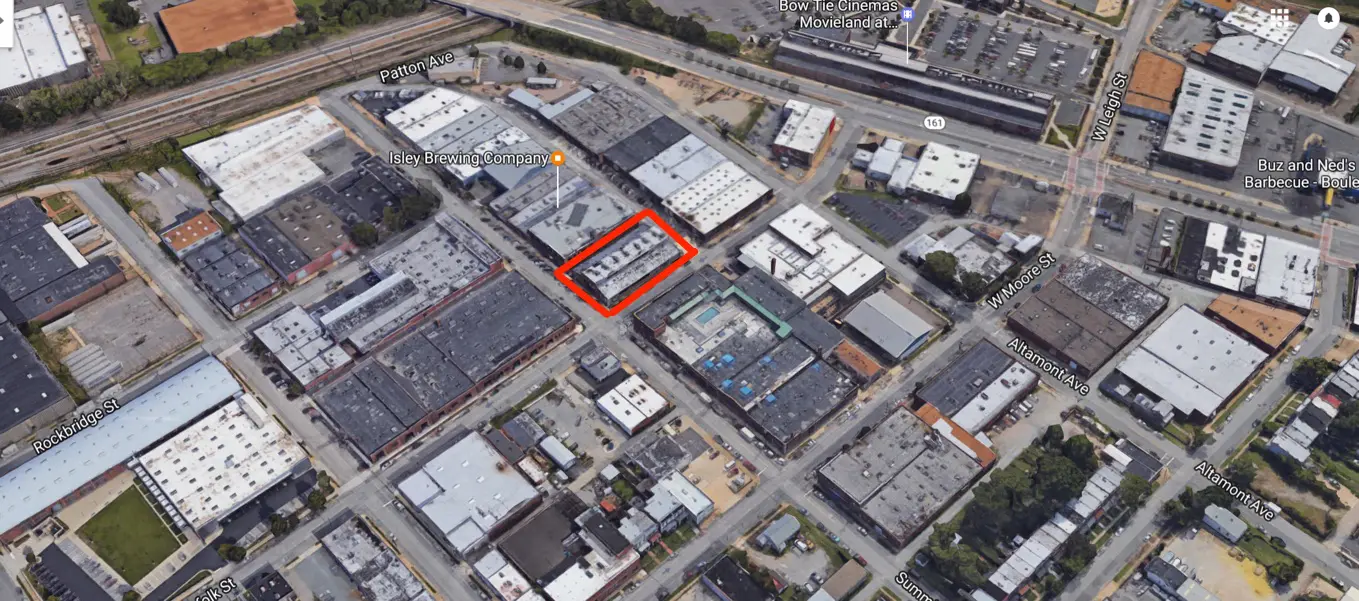
For the area that surrounds VCU’s Monroe Park Campus, you can see that pricing has been rising –– by about 30% over the last 5 years.

That could pay for a lot of college tuition.

Here’s Some Context:

The cost of a VCU dorm in 2020 is $11,506  (up from $7,800 in 2018)

  • Per our rental managers, the average cost of rent is anywhere from $600-700 per bedroom in a standard house.
  • To rent a 1 bedroom studio apartment, the number rises closer to $1,100 to 1,200 per month
  • To rent a 2 bedroom/2 bath apartment, you are likely to pay anywhere from $1,600 to $2,000 per month

The Numbers

So imagine the following scenario –– 

Purchase the home for $350,000 and sell it 4 years later for:

  • $409,000 given only a 4% annual appreciation rate
  • $425,000, given a 5% annual appreciation rate
  • $441,000, given a 6% annual appreciation rate
  • Instead of paying $11,000 in rooming costs to VCU, you received $1,300 in rent per month from two roommates
  • And you paid down your mortgage balance by roughly $20,000 to $40,000 depending on loan type, interest rate, etc.

    (As a small disclaimer: The past does not guarantee what the future will look like and the type of loan you choose and interest rate you receive will impact how quickly you pay down the mortgage balance.)

Loan Possibilities

Though there are some navigable hurdles, you can co-sign for your child and use a Maximum FHA loan that requires a very low down payment. There are also loan programs for non-owner occupied co-borrowers for less than 20% down. And finally, there are investor loans that allow you to purchase without requiring 20% down.

So all that said, you have options and not all of them require substantial amounts of cash.

So depending on what loan type you choose, we can help you find an originator who knows the market for investor and co-borrower loans.

But Aren’t Prices Going to Stop Rising?

Maybe if we solve the inventory problem or everyone decides to leave the city.

To solve the inventory issue, all we have to do is figure out how to build another, say, 3,000 or so houses per year around VCU (which if you aren’t detecting my sarcasm, is near impossible).

So while past performance is no guarantee of future returns, but, of all of the segments that offer value protection, it is housing that surrounds a 30,000 student university –– especially an urban one where the ability to add additional housing is essentially nil.

Furthermore, the fact that VCU’s housing need is largely supplied by the private sector means that the dorm life element of VCU is far less important than it is at other comparable institutions.

To back this statistic up, as we entered into the 2020 market, there was less than 2 months of inventory –– and that is as low as it has ever been.

Summary

So is purchasing for you? Not necessarily, but for many it makes a lot of sense.

The inventory issue is not really solvable and owning property next to perhaps the most important economic engine in the region has proven to be a great hedge against market downturns.

We can help.

2018 Housing Predictions and the Coming Affordability Crisis

December 22, 2017 By Rick Jarvis

The Next Crisis in Housing, and the 2018 Predictions

Each year, as December comes to a close and the promise of the new year begins, I try to share my thoughts on what the next 12 months will bring. And while I am not an economist, I did stay at a Holiday Inn Express last night … does that count?

(And here are 2017’s predictions, if you care to see how well we did)

I love data and what it can tell you if you look a little bit deeper. Furthermore, when you can add empirical evidence to anecdotal, you get some powerful intel about not only where the market is headed, but why it is headed where it is.

Welcome to 2018!

What the next 12 months will bring is important for all of us to know — from renters in Shockoe, to homebuilders in Chesterfield, to land owners in Goochland — in order to place our real estate holdings in the best position possible.

And just so you know, the words we will hear repeatedly in 2018:

  • Inventory
  • Interest rates
  • Affordability
  • Millennial

Inventory — Richmond, We Still Have a Problem

Unless you have been living under a rock (which also appreciated by about 4.8% last year), you have heard about the inventory crisis. Bidding wars are up, ‘Days on Market’ are down, houses are going for more than their asking prices on a regular basis, and everyone is clamoring for more inventory to help fix the problem.

If this chart doesn’t illustrate the extent of the problem, nothing can. This shows the available housing supply over the last 10 years.

In the aggregate, inventory levels are off by well over half from the heights in 2008 through 2010, and that doesn’t even look at the sub markets individually.

Now lets look at the buyer pool. The chart below tracks the number of houses that go under contract in any given month over the past 10 years (i.e. — absorption of housing)

Do you notice a trend?

The rate of sales, while not up anywhere as much as the inventory is down, it is still up by about 30% from the 2007-2011 period. As a matter of fact, there are actually more houses selling now than there were in 2007 and 2008.

So, just to reiterate:

↑ Absorption is up by about 30%
↓ Inventory is down by 60-70%

Yeah, that pretty much explains the price increases.

While I think we all recognize the inventory issue, unless you look at it critically, the deeper message is lost. What has really been happening is that population is realigning where it wants to live, impacting housing availability differently in individual sub-markets.

The Fall and Rise of the City

In the late 1980’s, Chesterfield, Henrico, and the City of Richmond were all populated equally with just over 200,000 residents each. Only a decade later (by 2000), the City’s population had fallen below 200,000 while both Chesterfield and Henrico had exploded to over 260,000 residents each.

It was an incredible shift.

Where Are the New Urban Houses?

But if you fast forward to today, what do you see? You see a city with a population growing at the same rate as the surrounding counties, if not slightly faster. And while growth of the urban core brings with it many positives, it poses a big problem with what is a fixed supply of housing.

Take a look at the table below — despite the same basic rate of growth in population, the number of new houses being built in the city accounts for anywhere from 4 to 6% of the overall market. When you compare that to 15 to 21% of the sales in Chesterfield being newly constructed homes, you begin to see the extent of the problem.

Year

New Homes in the City

Resale in the City

%

New Homes in Chesterfield

Resale in Chesterfield

%

2012

83

2110

3.9%

550

3588

15.3%

2013

121

2356

5.1%

723

3785

19.1%

2014

113

2370

4.8%

729

3818

19.1%

2015

108

2461

4.4%

828

4467

18.5%

2016

150

2629

5.7%

934

5039

18.5%

2017

154

2672

5.8%

1022

4819

21.2%

All cities, not just Richmond, lack sufficient land to develop housing with any scale. And when the population begins to seek housing in the urban environment, it puts pressure on the fixed stock of available housing. When supply is fixed and demand rising, you get rapid price increases. When supply can be added to offset demand, you might still see prices rise, just not at the same rates.

Richmond’s Affordable Housing

So where is the problem the most acute? In the affordable urban markets, that’s where.

The table below shows the number of sales in excess of $300,000 in the north and eastern quadrants of the city of Richmond, long a bastion of affordable housing. The number of transactions over $300,000 has increased from 15 to 129 in the past 5 years — nearly a 900% increase!! 

Compare this to west/central Chesterfield and, while you still see a problem, a 264% increase to be exact, it’s not quite as dramatic. Furthermore, the ability for Chesterfield (or Henrico, or Hanover) to manage their affordability issue is far greater as they still have hundreds of thousands of acres to develop to relieve the pressure.

Primary Year Number of Sales Above $300,000 in NE Richmond City Number of Sales Above $300,000 in West Central Chesterfield

2012

15

318

2013

29

379

2014

38

451

2015

56

620

2016

88

812

2017

129

842

The Problem Becomes a Crisis

In my opinion, this lack of urban housing will make 2018 the year Richmond’s affordable housing problem becomes an affordable housing crisis.

So if you are looking for urban housing, especially a more ‘affordable’ home in the city, here are some strategies you should employ to make your efforts as successful as possible:

  • get started earlier than normal
  • steer clear of online lenders as sellers — ok, seller’s agents — hate Quicken and USAA. Oh and their rates are the same, if not worse, so don’t believe the hype
  • expect to be involved in a bidding war
  • don’t rely solely on last year’s comparable sales to dictate predict pricing
  • act with urgency

(And if you want to read a reeeeeallly deep dive on affordable housing, you can do so here — The Affordable Housing Post)

Interest Rates

I think we have all been dreading the day when rates will rise. Sorry, but I’m calling it. Rates will rise in 2018 and continue to do so until they return to ‘normal’ levels in the coming 3 to 5 years.

Why? The economy is actually pretty healthy. Tax breaks, North Korea, and bipartisan bickering aside, we are doing pretty well, at least economically. Yes, we have crushing debt that our children’s children’s children will have to deal with, but all in all, employment is solid and the economy is growing at a decent pace.

So what is a ‘normal’ interest rate? I think the new normal remains to be seen as the inputs have all changed, but 6% to 7.5% or so for 30 year mortgages is what I think most industry veterans would consider to be ‘normal.’

Inflation

One of the primary drivers of interest rates (ok, mortgage rates) is inflation and when the market sees that inflation is creeping up, the price of money rises to hedge the loss of buying power over time. Stated differently, when you borrow money, each dollar you repay the bank has lost a little bit of its value. And while dollar today will have a similar value tomorrow, how much buying power is lost 5, 10 or 30 years in the future? You get the picture.

So the more inflation the market expects, the higher rates will rise, and as you can see, the trend line, while still below historical norms, seems to be moving up more than it is moving down.

And when you take the same chart and add historical mortgage rates, you see what is a pretty strong correlation. As inflation expectations rise, the interest rates tend to do the same thing (at least once the housing market stabilized in 2013.)

So if you want to know where the mortgage rates are headed? Keep an eye on the inflation expectation in the market. It will tell you (most) all of what you need to know.

Rising Rates — Good or Bad?

So are rising interest rates a bad thing? Does it matter if that rates are in the 5’s, 6’s, or <gasp!> even in the 7’s if the economy is roaring? If salaries are up, the stock market is at record highs, and profits are everywhere, does a mortgage payment 15 to 20% higher than today really matter?

As you can see, the percentage of our collective incomes that we spend on housing is not nearly as out of whack as it was in the years preceding the bubble — and that makes me feel good.

Do you know what else makes me feel good? The amount of housing debt we currently have outstanding relative to where we were. (And, for what it is worth, I am yet to see a chart that better illustrates the ‘bubble’ and the impact of it’s bursting …)

The bottom line is that we are still well below the debt levels of the bubble, and we are spending less of of our incomes on housing.

And also know that, as rates rise, people will begin to use loan products with built in rate adjustments to offset the increased mortgage payments.

Which leads us to …

Adjustable Rate Mortgages (ARMs) and 2018

Wait, did I just say adjustable rate mortgage?!? Isn’t what that got us in trouble the last time?!? Aren’t those loan products evil, and dangerous?!? Oh no, we are doomed!

Don’t panic …

In 2008, these were the reasons we developed a bubble, not the existence of the adjustable rate mortgage:

  • Credit score requirements were essentially non-existent
  • Verification of salary, job history, and liquid assets, all of which should have been confirmed by underwriters and processors, were not
  • Intentionally fraudulent (think — criminal) underwriting was far too common
  • Down payment requirements were as low as 0% (or even lower in some cases — do you remember the 125% mortgage?!?)
  • Many loans were interest only
  • No rate caps during each adjustment period

So when you allow someone with no liquid assets, a shaky job history, and basically no skin in the game to buy a house with a payment that will not only double in a year, but never pay down the debt, then yeah, you have a big problem.

The ARMs of Today

The adjustable rate loan products today look nothing like the adjustable rate products of 2006-2008. Today’s ARMs have realistic rate caps (meaning how much they can rise is limited), less frequent adjustment periods (every 3 years, 5 years or 7 years), and are underwritten to higher standards for income, debt, job history, and down payment.

So don’t worry, the adjustable rate mortgage that will soon reappear will be strategically used by buyers who are making a bet about how long they will live in a home, and not as bait to lure ill-prepared buyers into a ticking time bomb.

And the chart (below) showing homeowner ship rates in the US would seem to corroborate that statement.

The mortgage practices that created the 2008 bubble seem to not be in practice today.

Home Building

I’m worried about Richmond’s home building industry.

Huntt’s Row was a 8 units upscale town home project in Richmond’s Fan District.

Am I worried it is going to crash? No, not at all. I think you might see a little softening at some of the upper price points, but nothing to worry about.

Am I worried about the land developers? Not really, provided they have enough Xanax to deal with the public process that rezoning and development has become. But headaches aside, creating lots right now is not where the danger is (like it was in 2008.)

Then who am I worried about? I am worried about Richmond’s smaller and mid-sized, LOCAL homebuilders right now. They are in trouble if they don’t understand what is coming at them and adjust their business models.

Subs Rule

So imagine you are a subcontractor — bricklayer, carpenter, plumber, roofer, etc. — and you are bidding a job in Richmond for a local homebuilder. You turn on CNN and see Hurricane Harvey flooding out Houston ($200B in damage), followed immediately by Irma ($67B in damage) cruising up the gulf coast of Florida flooding out houses and ripping off roofs. And then a few short months later, you see that California is completely on fire (and still is as we write this article) with entire communities going up in flames instantaneously.

So what do you do? Do you pack up the van and move to Houston, Tampa, or Santa Barbara to set up shop for the next several years while rebuilding beachfront mansions on the insurance company’s dime? Or do you simply add 20 to 30% to your bid knowing that many of your competitors are already on 64W or 85S to do exactly that.

In 2008, when new homebuilding essentially ceased, much of the homebuilding labor pool disappeared. They retired, got other jobs, or simply left the business altogether. So when you combine an already reduced labor pool with a sharp demand increase in extremely affluent markets (i.e. — California / Florida’s gulf coast) destroyed by recent natural disasters, you can imagine the impact not only on the price of labor, but of materials.

The Big Guys Have Arrived

And if a spike in labor and materials is not reason enough to stress, Richmond now is home to two new regional / national homebuilders who bring efficiencies and economies of scale that can suck all of the margins out of a market.

DR Horton, the nations LARGEST homebuilder, and Schell Brothers (only #74 if you are scoring at home, but still an extremely large regional homebuilder), arrived in 2017. Stanley Martin, #57, arrived in 2015, and lets not forget about NVR / Ryan Homes (#4 overall) that has been building in Richmond for decades.

DR Horton closed 41,000 houses in 2016, if you care to know…

The big guys come with unlimited buying power to take control of the available lot inventory, the ability to build models that contain every imaginable option to wow the public, a sales organization designed to hook the buyers with low prices and then upgrade the heck out of ’em, the promise of volume to suck up all of the labor, and engineered floorpans that can be built at significant cost savings.

AND (and this is a big AND), the national builders build fast. When they get rolling, they can produce housing at an incredible rate. When the music stops (and it will, but I still don’t think it is anytime soon), overproduction will impact both the rate and the length of the housing adjustment. So when they decide the time has come to cut prices and unload inventory, their actions can really hurt the smaller guys whose pockets are not nearly as deep.

Local vs. National

When compared to the smaller and mid-sized builders that have traditionally populated Richmond’s building scene, you can see how the future for our local guys will be far more difficult.

In 2018, I think you will see a fundamental shift in power from the 5 to 50 home per year local builder to a 100 unit-per-quarter type publicly traded builder, especially at the middle and upper price points, whose production machine will change the way Richmond builds (and buys) houses.

So while home pricing might be going up and demand is still rising, building costs are rising even faster and competition from extremely well funded large builders is rising as well. Much like the impact WalMart and Target had on local retail, the arrival of the big builders will drive down margins to levels that will make building a very dangerous endeavor for those who lack the ability to build at greatly reduced costs.

And I am not ok with that, if you care to know. Maybe it is the prideful Richmonder in me, but I don’t like the idea of national homebuilders determining our local stock of homes and the Richmond stalwarts getting squeezed.

So What Does it Mean for the Local Guy?

It means being nimble, opportunistic, and above all else, smart.

Going head to head with Ryan, DR Horton or even local behemoths like Eagle or HH Hunt is a no-win game. The new way will be more of a hit and run model, seek opportunity where others are not looking, operating in markets where it is difficult to find scale (think — infill and urban markets!), and/or establishing a specific stylistic niche that will cause clients to seek you out.

Trying to beat a national volume builder with endless capital is like trying to beat a Las Vegas casino — over time, the casino always wins. Their cost of capital, cost of labor and materials, access to lots, and sales infrastructure give them a 10 to 15% baked in advantage — and those advantages are really hard to compete with day in and day out.

The Commercial BOOM

Most of you probably realize that One South is a mixed-use firm that offers residential sales, commercial sales, and development representation, and thus we can speak about the commercial market a bit as well.

From Richmond BizSense’s commercial market round up a few months back. It was a good week, to say the least.

The commercial market is rolling, in case you haven’t heard.

Without going into too much nitty gritty detail, pricing on the commercial side is pretty insane. Cap Rates (which represent the ratio of income to price) have shifted significantly in the past 24 months – about a 2 to 3 point shift – especially for multi-family opportunities.

When Cap Rates shift from 7% to 5%, a property that used to cost $1,000,000, will now trade closer to $1,400,000. That’s no small change.

From REIS, Inc, a real estate data provider. This chart shows nationwide Multi-Family cap rates over 5 years.

Why the Shift?

The reasons are many but what is driving the market as much as anything is an influx of out of town buyers who have been priced out of the larger metropolitan areas (D.C, NYC, Charlotte) looking for deals in Richmond. Richmond’s improving profile and exploding local scene, as well as the insatiable appetite for apartments mostly driven by VCU, has given larger regional and national players in the multi-family scene reason to stop in and buy up our buildings. And when they look at our relative value, they feel excited to pick up properties here that are fully leased, well built, and extremely well located.

So to Summarize

If you made it this far, thanks.

And while we covered a lot, we didn’t even touch on rising rents, the Bus Rapid Transit that has physically destroyed Broad Street, the condo market, college debt, or tax breaks, either!

I guess we’ll save those topics for another day.

But don’t worry! Despite rising pricing, 2008 redux is not on the horizon. The conditions that existed in 2008 do not, I repeat, DO NOT exist currently. (And if you want to dive in deeper to the differences, you can read this article — The B Word, Bubble — that we wrote last year.)

Can pricing continue to rise unabated?

If demand outpaces supply, then yes it can.

Are we seeing some some softness in the suburban new home markets at upper price points? Maybe. But as a whole, the market is still significantly undersupplied.

Furthermore, there is neither a fix for the supply issue (other than building more homes further and further from the urban core) nor a likelihood that the first time homebuyer will give up and stay a tenant. As a matter of a fact, I actually think the buyer supply will increase as more and more millennials decide to become homeowners and the supply problem will get worse before it gets better.

Will interest rates rising make housing more expensive to own and temper prices?

Perhaps, but when our wallets are fat and our confidence high, then we buy, even if our mortgage payments take a little more of our disposable income. I don’t think we will see prices flatten until we see 2 to 3 points of increase in long term mortgage rates.

So if you are getting ready to buy …

Prepare yourself.

It is a highly competitive market, especially if you are looking at urban markets or for quality affordable housing.

If you are thinking of selling …

Make sure to extract the correct terms from your buyer that will allow you to re-purchase comfortably and without undue stress (just ask us how!)

And if you decide to build a new home …

And you are buying it from one of the large builders in Richmond with a flashy showroom and highly skilled upgraders, beware. They are reeeeeallly good at their job.

So When Will Interest Rates Rise (and does it matter if they do)?

November 6, 2017 By Rick Jarvis

For what it is worth, the 2017 real estate season was a blur. And we began 2017 on the heels of what we thought was a blur of a season in 2016. Ditto 2015, and 2014 before that.

All About 2017

For each of the past several years, the market has pushed itself upwards at ever increasing rates in terms of both pricing and sales volume.

So what did we see in 2017?

  • we saw prices rise in most markets rather substantially
  • we saw transactional volume climb
  • we saw inventory continue to be at historic lows
  • we saw new housing starts continue to lag
  • we saw multiple offers and bidding wars in increasing numbers

But do you know what we didn’t see? We did not see interest rates climb.

As a matter of a fact, they actually fell.

Wait, what?!?

Rates Remained in the 3’s for Much of 2017

30 year mortgage pricing actually declined by about 1/2 point from January through November.

Yes, rates DECLINED over the course of 2017.

Despite Janet Yellen’s imminent departure as Chair of the Federal Reserve, the North Korean nuclear threat, BREXIT, Russian election meddling, pending changes in the tax code, low unemployment and a booming stock market, 30 year mortgage pricing actually declined by about 1/2 point from January through November.

Go figure.

See the chart below to see how 30 year mortgage rates tracked over the past 5 years.

You can see the trend — and (at least for now) it isn’t up.

So When Will They Go Up?

inflation (or the expectation of it) is what drives pricing for the long term interest rates.

Good question and no one really knows — and that includes the Federal Reserve.

Despite the fact that the US economy is on increasingly solid footing with low unemployment and a robust stock market, there is little inflation on the horizon. And for those who maybe slept through their economic classes, inflation (or the expectation of it) is what drives pricing for the long term interest rates.

The chart below shows the inflation expectation in the market and as you can see, it is not on an upward trajectory.

So until the numbers show inflation creeping in, interest rates will stay well below historical norms.

But more on that in a moment.

What Happens When Rates Rise?

As a matter of a fact, rising rates might mean housing prices rise, too.

So what will happen when rates do rise? Will rising rates stem the tide of price increases? Or will home prices actually begin to decline? Or even worse, will it be 2008 all over again?

No, not likely at all. As a matter of a fact, rising rates might mean housing prices rise, too.

WHAT?!?

Inflation generally occurs when two things happen — the economy is growing AND wages are rising. Right now, despite an economy that is doing fairly well, wages are stagnant, and have been so for some time.

So if the market begins to experience inflation, it means that wages are likely rising, too, and the economy is really starting to heat up. So any negative impact rising rates will be offset by rising wages. Stated differently, the home buying public will not only have the income necessary to cover the rising cost of the mortgage, they are likely to have income in excess of what is required and buy bigger, better and newer housing.

Take a look at the chart below to see how much we are spending on our housing and you can see how much more (in theory) we could be spending on housing before it becomes an issue.

Does that make you feel any better?

Remember the ARM?

why would you pay to have a mortgage rate for 30 years when you are only going to be in the home for a fraction of the time?

Another very important factor is the type of mortgage buyers will choose.

When 30 year mortgage rates rise, buyers tend to migrate into the adjustable rate mortgage products like the 7/23, 3/1, 5/1 and 7/1 ARM’s. ARM products (aka Adjustable Rate Mortgages) offer a mortgage with a fixed rate for a shorter time frame (typically 3, 5 or 7 years) and then begin to adjust based on a predetermined index.

See the chart below to compare. Would you take a 20-25% lower mortgage payment for 5 years of mortgage certainty? Many would, especially if they expect to stay in the home for 5 to 10 years. Think of it this way — why would you pay to have a mortgage rate for 30 years when you are only going to be in the home for a fraction of the time?

In more normal interest rate markets, ARM products can be anywhere from 1 to 3 rate points better, and that is a big enough spread to make people change from the 30 year fixed rate to one of the hybrid products.

So when rates start to climb into the 6’s and 7’s, you can rest assured that many buyers will elect ARM’s that will have start rates in the 4’s and 5’s — keeping affordability similar to where it is now.

Don’t Worry About Rates

so interest rates can effectively double before buyers will change behavior.

Am I saying that prices will continue to climb unabated? No, I am not. Any number of factors could cause an adjustment — but interest rates rising into the 6’s won’t be the cause. As a matter of a fact, most experts feel that house pricing is immune to interest rates even into the middle 7’s — so interest rates can nearly double before buyers will change behavior.

Take a look below at interest rates over the past 50 years to get a sense of how rare this interest rate environment actually is. For those who entered the housing market after the 2008 crash, then all you know is rates below 5%. But for those who have owned housing as far back as the 1980’s or 1990’s, today’s rates seem laughably low.

So if you want to find something to worry about, keep you eye on the economy, tax reform, housing inventory, construction starts, and rent levels (ok, and North Korea) and stop worrying about rising interest rates changing housing’s trajectory.


So You Bought in 2007 …

June 9, 2017 By Rick Jarvis

bubble popingSo you bought a home in 2007, eh?

Don’t worry as you are not alone. Many others bought in at or near the top of the market, just like you did, only to watch the value crumble by anywhere from 20% to as much as 50% in only a few short years.

No one was immune.

Pricing is Back — Mostly

But we are here to deliver good news — the time to sell may be now.

One of the takeaways from the post crash recovery is that each sub-market in the Richmond area has recovered differently.

Shifting demographics, shifting preferences, and the ability to add new inventory have all dramatically impacted the speed of the recovery in each of the regions of Richmond.

Take a look at below — the average ‘per foot’ price broken down by county — and you will a trend that shows the market has largely recovered in most of the areas of Richmond.

The Loss of Equity

most underwater homeowners simply stayed put and waited it out.

Just because property values drop, the money owed on the properties does not. So when the market shifted and values fell, many owners found the mortgage debt on their property to be higher than the actual values.

When the debt is greater than the value on a home that is sold, an owner has to make up the difference — in cash — to pay off the mortgage. And in the darkest economic days post-crash, few were willing to part with any of their savings. What happened was that most underwater homeowners simply stayed put and waited it out.

But now that pricing has retuned (or seems to be close to 2008 levels), owners can walk away with cash when they sell — and use it to move to the next home.

The Mortgage Market Shift

people tended to stay put in lieu of sinking cash into large down payments.

When equity took a nose dive, the loan products that offered higher leverage (i.e. lower down payments) also went away. Very few 5% down payment loans were available during the collapse and thus, even if you could sell your home, you needed a tremendous amount of cash to be able to buy the next one.

And again, people tended to stay put in lieu of sinking cash into large down payments.

As 2008 – 2011 gets further and further into the rearview mirror, more and more low down payment loans are becoming available again. And while the merits of buying a home with 5% down probably deserves an entire post on its own, it does tend to make housing within reach of the first time buyer — and that is not all bad.

Pricing is Rising

remember that the pricing of the housing you are looking to buy is also rising; and in many cases at a faster rate.

So the takeaway is this — if you bought in 2008 and have been holding out until you could get out, remember that the pricing of the housing you are looking to buy is also rising; and in many cases at a faster rate. Stated differently, if you bought a newer home in the far suburbs in 2007 and you are looking to downsize back into the City, do it now. The pricing in the city is rising faster than in the ‘burbs and everyday that you wait just makes the next home that much more expensive.

In almost every case, selling a home means buying another one. Make sure you are not holding onto a home that is appreciating at 2% per year to buy one appreciating at 5% per year. The longer you do, the further you fall behind.

Summary

A good agent can help you determine not only the price of your home, but also give you a sense of how the market conditions of where you want to go. The best way to make back your money is by owning the asset that is appreciating the fastest.

Opportunity in the Condo Market

April 10, 2017 By Rick Jarvis

'If you were in our shoes, what would you do?' is one of my favorite questions...’

It was the latter part of 2011 when we got a call from a couple living in New Hampshire. They had a child who was coming to Richmond to attend VCU and they wanted to purchase a small home or condo (no maintenance is a good thing for a college student).

They were betting that the market was at its bottom (which it probably was) and they were looking for upside.

One of the questions they was asked was, ‘If you were in our shoes, what would you do?’

It is one of my favorite questions.

What Drives the Market?

I have a personal theory that, as an agent, my primary job is to help clients understand the factors that drive the market. Clients who understand why values are what they are make confident and empowered decisions.

Summit Lofts in Scotts Addition
The Summit Lofts in Scotts Addition is now tucked in amongst cafes, several breweries, and new retail spaces. All of the development ceased in the years immediately following the crash and began again in 2013 and 2014.

Clients who understand why values are what they are make confident and empowered decisions.

Larger market conditions — interest rates, employment, taxes — are all largely held constant and are beyond anyone’s control. Market values in the aggregate ebb and flow due to factors well beyond any individual’s ability to impact them. But if you make a good decision about your specific property, when the market rises, the value of your home rises more quickly. Conversely, when the overall market falls, your home’s value does not fall as quickly.

By focusing on hyper-local market conditions like nearby development, incentives, supply, and demand we help our clients acquire properties that are more likely to outperform the market, regardless of the direction it is moving.

All of these factors are easily recognizable to the trained eye. And while they can vary wildly from neighborhood to neighborhood and project to project, the key is understanding how these are likely to impact values moving forward.

Looking for Clues

Maybe it is our experience in project representation and development, but seeing upside in specific condo projects is relatively easy.

Keeping an eye on development, historic designation, the city’s Enterprise Zones, or zoning changes in a specific area is critical in spotting opportunity.

  • RichmondBizSense.com on Scotts Addition
  • Richmond.com on Scotts Addition Zoning Changes
  • Scotts Addition Historic Lines
  • Enterprise Zones — City of Richmond

When you follow the development market, seeing areas poised for price spikes becomes second nature.

Furthermore, condominium values tend to fluctuate more than single family, largely due to the impact of mortgage financing. Mortgage financing is more impactful than any other factor in condo values.

So when you see a) a condo project who recently regained its ‘warrantability’ (which is the industry term meaning ‘available for conventional finance’) or b) a project in a district experiencing intense development, it is a great buying opportunity.

Case Study — The Summit Lofts

Temporary factors had depressed values in the project and, once removed, values were likely to rise more quickly than the market as a whole.

In the mid 2000’s, the partners at Monument Construction, bought a small warehouse and converted it into 14 loft-styled 2 bedroom condos. The units were a good size — roughly 1,300 to 1,400 SF — and were nicely appointed. When they sold initially, most sold in excess of $200,000.

The neighborhood, Scotts Addition, had just been named a ‘historic neighborhood’ by the Department of Historic Resources, meaning that many incentives were now available to developers that made projects far more feasible. The historic designation is the number one accelerant for new development and once an area becomes designated, it is in very short order that a transformation begins.

Then 2008 happened.

Prices fell substantially in the Summit Lofts as several units were foreclosed upon and others became rental properties.

The condo lending rules changed substantially in the years following 2008’s crash. When conventional mortgage financing is no longer available, alternative forms of financing are required that are far less attractive (i.e. — higher rates, shorter terms, higher down payments). This suppresses values.

The Summit Lofts values suffered from both a lack of conventional financing and the loss of development momentum in Scotts Addition — but the fact remained that it was a nice property with good floor plans, nice finishes, and a soon-to-be phenomenal location. In other words, temporary factors had depressed values int he project and, once removed, values were likely to rise more quickly than the market as a whole.

So when our clients were looking for a place for their son, we talked about Summit and why it was a good bet. The development momentum was beginning again and the mortgage financing rules were being relaxed — meaning Summit Lofts now qualified for conventional mortgages.

Our clients made a purchase in April of 2012 and held the property until their child graduated in the summer of 2015.

  • The condo was purchased for $143,000 in April of 2012 and sold for $169,000 in September of 2015. Its value increased by 18.2% (7.8% annually) during the time it was owned by our client. Not too shabby.
  • The condo market overall in Richmond had a median sales price of $175,000 in the second quarter of 2012 and a median sales price of $189,000 in the third quarter of 2015. The market rose 7.6% (3.2% annually) during the same time.

And as you can see, their return on their investment was nearly 250% better than the overall market.

Why? Because they understood why the pricing was lower than it should have been and why it was likely to rise more quickly than the rest of the market.

Summary

We can tell many more stories about how we have helped clients acquire properties with upside as well as helped them avoid properties whose fundamentals are poor and values are likely to stay depressed.

Condos can be tricky animals and you need to understand the additional factors that underpin their market. As city markets tend to shift more rapidly as well, understanding how incentives can help drive values is also critical in making good decisions.

When you can spot fundamental changes in the inputs that drive values (financing, incentives, nearby development), you can find opportunities to out-earn the market.

If you want to do a deep dive on condos, check out our Ultimate Guide to RVA Condos here…

  • « Go to Previous Page
  • Go to page 1
  • Go to page 2
  • Go to page 3
  • Go to page 4
  • Go to page 5
  • Go to page 6
  • Interim pages omitted …
  • Go to page 9
  • Go to Next Page »

Primary Sidebar

804.201.9683


How Do I Schedule a Showing or Find Out More?

I am Kendall C. Kendall, Client Care Coordinator for the team. I am a licensed Realtor and it is my job to answer questions and schedule showings for the properties shown on our sites. Here's our call policy.

kendall@richmondrelocation.net

Working With Buyers

I am Sarah Jarvis, Broker at One South and I work with our buyers. I bring 20+ years of experience to our Buyers Advocacy program and take great pride in helping our clients understand the RVA marketplace.

sarah@richmondrelocation.net

From the Blog

Pricing a Home is Predicting Buyer Behavior

Dear Property Owners, The entire real estate world is doing you a disservice. Sincerely, Past Sales Our industry is set up to determine values of homes based on the sale of other homes considered to be 'similar.' The determination of what is similar is largely based on location, size, features as …

[Read More...] about Pricing a Home is Predicting Buyer Behavior

More Posts from this Category

  • Facebook
  • Instagram
  • LinkedIn
  • Twitter

The Ultimate Stats Page

Ultimate Stats Page

Latest Tweets

  • Just now

Footer 1

Test Text

804.201.9683


How Do I Schedule a Showing?

I am Kendall C. Kendall, Client Care Coordinator for the team. I am a licensed Realtor and it is my job to answer questions and schedule showings for the properties shown on our sites. Here's our call policy.
kendall@richmondrelocation.net

804.305.2344


How Do I Determine What I Can Afford?

We offer competitive mortgage solutions with a commitment to exceed your expectations. We’re local industry experts who are also your friends and neighbors. Whether you want to communicate online or in person, we’re just a call or click away.
www.cfmortgagecorp.com
C&F Logo

Equal Housing

The Sarah Jarvis Team agrees to provide equal professional service without regard to the race, color, religion, sex, handicap, familial status, national origin or sexual orientation of any prospective client, customer, or of the residents of any community. Any request from a home seller, landlord, or buyer to act in a discriminatory manner will not be fulfilled.

IDX Disclaimer

All of the information displayed here is deemed to be gathered from reliable sources but no warranties, either express of implied, are made part of this site. Additionally, the IDX Feed for listing information may contain descriptions of properties not represented by One South Realty, its agents or staff and any violations or misrepresentations are the sole responsibility of the listing brokerage of the subject property in violation.

Contact The Sarah Jarvis Team

804.201.9683

One South Square Logo

2314 West Main Street Richmond, VA 23220

sarah@richmondrelocation.net

Our Call Policy

Accessibility
Copyright

Lending

Southern Trust Mortgage Logo

Chris Lester
Senior Loan Administrator
NMLS# 353830
804-307-7033
Email Southern Trust Mortgage

Our Network of Sites: RichmondVaNewHomes.net, RichmondVaCondos.net, RichmondLuxuryNeighborhoods.com,
RichmondFanRealEstate.net, RichmondVaMLSSearch.net
Housekeeping: Sitemap, Listings Sitemap


Members of the Sarah Jarvis team are licensed in the Commonwealth of Virginia.


Loading Comments...