Time is money—no question that that is about as cliché as it gets. But it also happens to be true, especially in real estate. That’s why the ability to do a “quick and dirty” analysis of a transaction is absolutely critical. If you abide by some basic “rules of the game,” you can quickly identify the bad deals from the good and reduce your exposure to mistakes.

Here are some of those rules of the game that experienced Realtors use every day:
The New Home Premium
This one is a must for builders—whether they’re pricing homes for sale or gauging whether to purchase buildable lots. Certainly construction costs are a fundamental input to pricing, but a good builder always has an acute sense of a given market’s desire for new housing over existing housing. Put another way: how much will a buyer pay own a new home versus an existing one? If a relatively similar brand-new home and a 10-year-old home are both priced at $400,000, a buyer will almost always choose the new one. But can the builder charge more for the new home—and how much? $20,000 more? $40,000?? $60,000??? This is what we had to figure out when we were pricing the Citizen 6 Project on Floyd Avenue and the Tribeca Brownstones in Randolph.

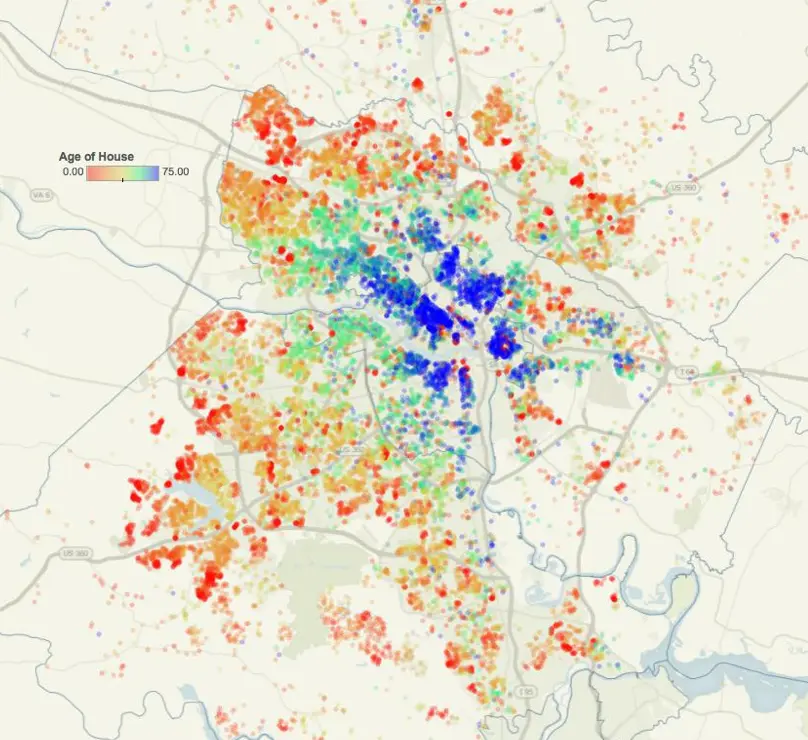
But understanding how tocalculate this premium isn’t useful just for builders. A buyer is better equipped if he or she understands this calculation as well. Depending on the age of the home, the location, and the number of new homes available, a new home premium can fall anywhere between 7-20 percent (read more about thing you should know when building a home.) In neighborhoods that are somewhat starved of new homes, the premium can go even higher. On the other hand, if an existing home is still pretty new—say, fewer than three years old—the premium will shrink. This can help in areas that might have lots of new housing nearby.
The ‘Lot to Improvement’ Ratio
The ratio of “lot to improvement” is really the percentage of the total value of the property that belongs to the land. Stated another way, how much of the TOTAL value of a property is in the land and how much is in the house? In the Richmond metro area, land value usually hovers between 20-30 percent of a property’s total market value…meaning that a home whose price is $500,000 is built on a lot whose value is roughly $100,000 to $150,000. Naturally, this is not a fixed ratio. A home’s age and neighborhood quality will affect this ratio. But when you’re talking about a consistent type of housing in a relatively young neighborhood, perhaps around 20 years old, this measurement is pretty reliable.

Before you make this a true rule of thumb, understand that it’s a hyper-local calculation. Different regions can have radically different ratios for any number of reasons. Look at the Washington, DC, metro area: land value approaches 50 percent in many neighborhoods. In the Outer Banks, especially along the ocean, you’ll see ratios climb even higher. Interestingly, Charlotte, with a much larger population than Richmond, has remarkably similar ratios as Richmond.
When is this ratio useful? Well neighborhoods where there are spot lots still lingering, creating a building opportunity in a mature area. It can also be useful when deciding whether or not to build or buy an existing home or in understanding likely appraisal values when building a home outside of a typical subdivision (rural areas, mixed-use areas, or mature infill areas.)
Tear downs, also known as “pop-a-top,” can really benefit from this ratio because of a lack of comparable sales.’ As populations continue to surge upward in urban areas, there is a scarcity of new housing. Some suburban builders have sought to massively upgrade existing homes closer to city centers to maximize the value of the land upon which they sit. Builders can combine the Lot to Improvement plus New Home Premium to arrive at the new value of a renovated home.
$X per $1000
When you hear someone saying $5 per thousand or $7 per thousand, they are generally computing a mortgage payment.
If you look at a 30-year mortgage, monthly P&I payments will land pretty closely to the interest rate times the number of thousands borrowed. It might be clearer seeing the numbers in action: a 30-year mortgage of $300,000 would be $300 x 5, or $1,500. That’s not that far from the actual figure, given that something close to today’s rates puts P&I on $300,000 at 5% at $1,443. If you want to add in for taxes and insurance, bump the interest rate by one point and recalculate. If a borrower secured a $300,000 loan at 5%, the P&I + T&I (remember to add one to the 5%) would fall somewhere around $1,800.
(Want a sense of current mortgage rates, you can find them here…)
These calculations can be most useful with less experienced home buyers in the earliest stages of buying a home. It’s not a perfect technique and won’t work in all cases. But it does work in many and can give the borrower a decent idea of what monthly tab will be to own a particular home. Be careful to adjust upwards for loans where mortgage insurance is involved or for loans with amortizations less than 30 years.
Cash Flow, Down Payment and Break-Even
The rules of any game are certainly debatable, but I can’t imaging I’d get much of an argument on this one:
If you can buy a property with no money down and break even, it’s probably a nice deal.
If you can buy that property with 10 percent down and break even, we would probably call that a market value deal.
If you’re putting up 20 percent or more and still only breaking even, you might want to rethink that purchase (unless there is another angle to the investment)
I see this all the time on property brochures: “Cash Flow Positive” and I find it personally offensive. Every income property is cash flow positive if you can make a big enough down payment. Come to the table with the entire purchase price in cash—wow, you are going to see some positive cash flow (and hopefully you noticed the sarcastic tone.) What buyers really need to know is how much cash it takes to make the property flow…for the reasons stated above.
You have to be aware of this metric when you’re investing in real estate. In almost every case, what you’re really seeking out is return on your equity, or cash. Every real estate investor should have his or her own investment criteria—and if you don’t, it’s about time you started putting them together—which will influence the preferred types of investment options (multifamily, single family, land, net leased investments, and so on). Bottom line is the value of the rents relative to the value of the property should make sense (this is also known as the CAP Rate or Capitalization Rate.)
So before you go signing any contracts to buy, understand exactly how much cash will be coming to you every month, and what kind of cash you have to put up to generate that flow.
Expense Ratio
The expense ratio is the cost of utilities, taxes, all your insurances, and repairs/maintenance that a property will incur relative to gross rents. It won’t come as any surprise that older properties generally have higher ratios than newer ones. Same goes for assets with more tenants.
A six-unit apartment building in the Fan renovated in 1984 might shoulder a 40+ percent expense ratio compared to gross rents. Across town on the South Side, a newly renovated 22-unit property with new windows might be closer to 25 – 30 percent.
This ratio is critical when you’re putting a seller’s financials under the microscope. If you come across a seller touting a 25 percent expense ratio on a 1920s-era multifamily building, be very, very suspicious. Alternatively, an owner of a garden-style apartment complex might overstate expenses by coding maintenance items incorrectly as capital expenditures. Good investors will see that, and possibly use it as leverage.
Other Metrics to Know
There are a few other metrics (or inputs) that good agents pay close attention to. While they can’t stand on their own to evaluate a property, they can, when combined with the rules above, help provide an ever more accurate picture of what’s at stake. I have seen sharp, savvy agents agents be dead right on a transaction analysis without ever putting pen to paper. How? They understand extremely well everything we’re talking about here.
All good agents, investors, and developers will be well acquainted with these inputs (and the 2016 answers):
Construction Cost per SF – Today, it will run about $70 – 80/SF to build a basic home and more in the lower $100’s/SF for a home with a decent level of finishes (this does NOT include land cost.) If your builder is spending north of $160/SF+ on materials and labor (NOT including land) then you had either be buying a neo-classical version of the Taj Mahal or you need to take a timeout and start asking some serious questions.
Current CAP (Capitalization) Rates – When looking at institutional-grade properties, most investors are looking at a Cap rate somewhere around 6 percent. Basic apartment properties trading anywhere between 6.5-8 percent. Lower grade apartments—history of collection problems, serious restoration issues—will certainly trade higher, anywhere between 9-13 percent.
Current Mortgage Rates—Despite all the mortgage shenanigans of the early oughts, mortgage rates are still historically amazing. Good credit risks can get 30-year money below 5 percent. Adjustable rate mortgages can be for north of 3 percent. (October 2015.) If you want to know more about how interest rates are priced, read this.
Residential Rental Rates per SF (quoted monthly) – Rental rates in the Fan and Museum District are anywhere from about $1.00-1.25 with Downtown properties receiving closer to $170-1.80 per foot in rents. The counties run closer to $1.00/SF mostly due to larger home sizes. When an apartment owner has a new property and includes most or all of the utilities, this number may reach (or exceed) $2.00 per foot in smaller apartments.
Market Values per SF (sometimes referred to as $/SF or “price per foot”) – Suburban Richmond prices per foot for brand-new construction run from a high of about $185/SF (Nuckols Road corridor) to about $170/SF for new homes along Robious Road. If you’re willing to look at moderately older properties, say 1990s, thos will trade for between $110-140/SF depending on locale. And, of course, properties in the more historic areas, such as the Fan, the Museum District,and Near West End will trade between $180 and 240/SF.
Conclusion
The rules I’ve discussed certainly aren’t set in stone. The real estate market is constantly evolving. So the smart investor has to evolve too and keep an eye on everything. If you’re diligent, you will be in the ball park far more often than not. And if you’re evaluating a property whose numbers aren’t working, that doesn’t mean there isn’t value there. But you’ve got to do some more work.
Ultimately, these “rules” are guidelines. They will give you some immediate insight, but they’re not a substitute for in-depth analysis and hard work. Over time, they will likely become second nature, and you’ll save time and quite a bit of money.


