• Skip to primary navigation
  • Skip to main content
  • Skip to primary sidebar

Sarah Jarvis Team at One South Realty

at One South Realty

  • Search MLS
  • Stats
  • Deals!
  • About Us
    • The Team
    • Testimonial
    • 5 Things I Tell My Clients
  • Calling Policy
  • The Blog
  • Show Search
Hide Search

Development

Market Caps

October 26, 2016 By Rick Jarvis

marketcaps‘Too big for the street.’
‘Overbuilding.’
‘The white elephant.’

All of these terms are a way of describing a home that somehow is out of place from a value perspective. Perhaps it is too nice or perhaps too big — but the home exceeds what the market would be willing to pay for it based on its location.

What is a Market Cap?

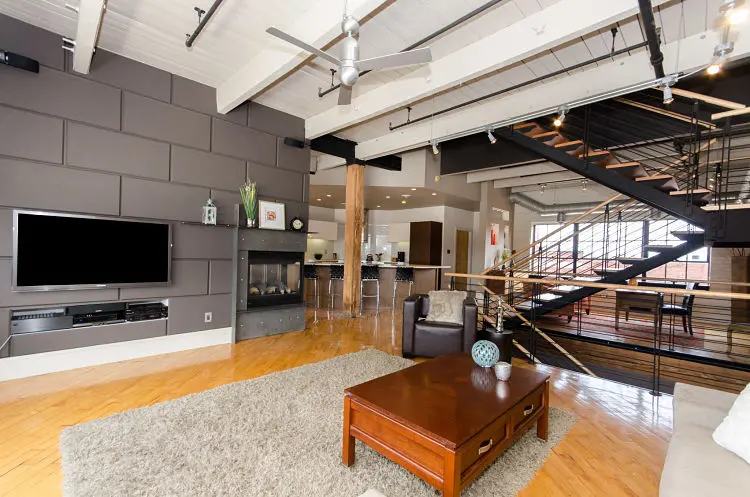
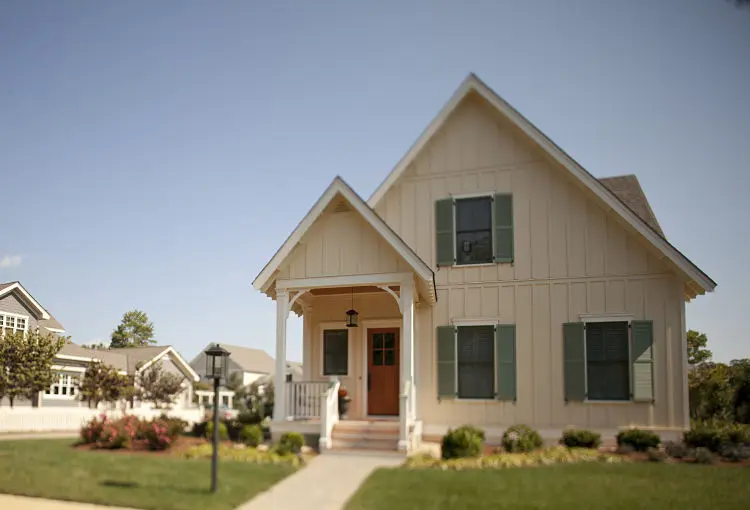
Imagine a neighborhood of modest vinyl sided 2,000 SF two story homes with 1 car garages whose average sales price is $300,000. And then imagine you see a 4,000 SF 5 bedroom home, made of brick, with exotic hard wood floors, central vacuum, pool and hot tub and a 3 car garage sitting right in the middle. Do you think that the brick home will sell for $600,000? I doubt it.

A market cap is nothing more than a price above which people are unwilling to pay in a certain area — regardless of how good the deal may appear or how many features the home may have. Generally, the egregious violations of the market cap concept are relatively easy to spot — as in the example above.

But finding market caps can become far more difficult when you are looking at infill opportunities or substantial renovations.

How Do You Find a Cap?

Finding market caps is as much art as it is science, but if you know how to look, spotting caps can become relatively easy.

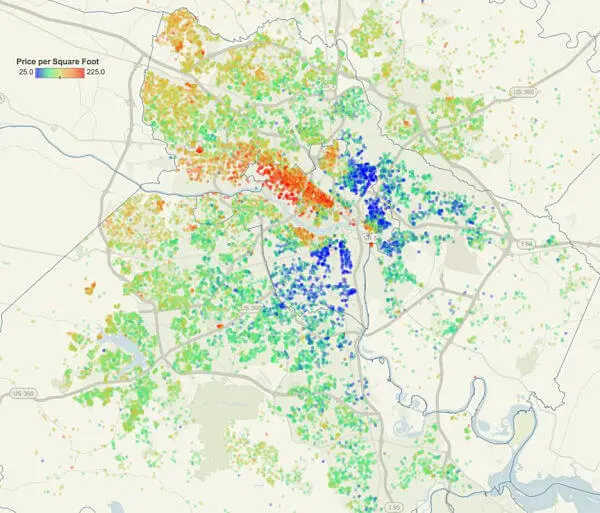
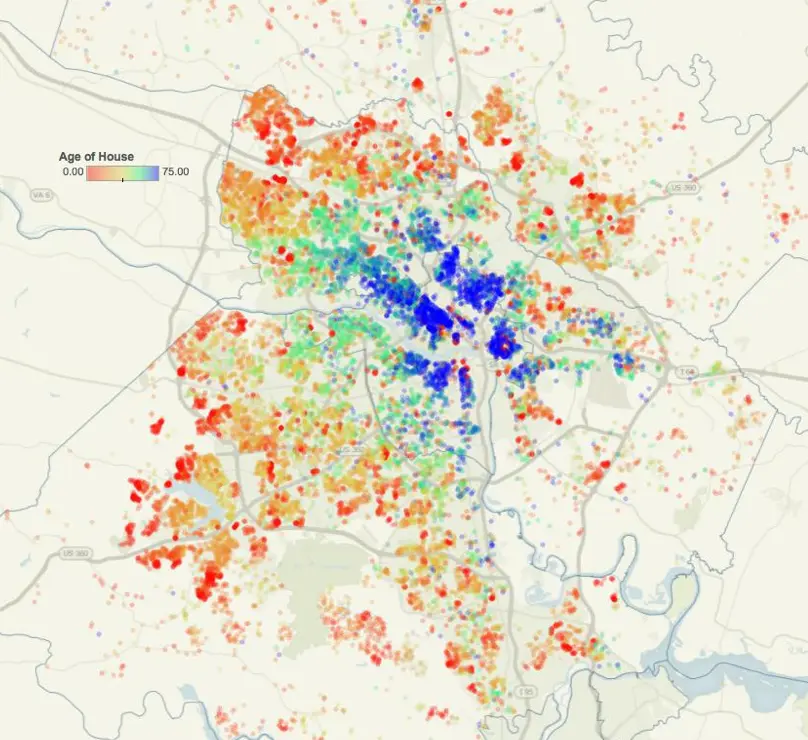
The Multiple Listing Service (MLS) tracks all sorts of statistics — from home size, age, features and materials to a tremendous amount of data about geography, prices and marketing times — and we can use the data to look for radical changes in behavior.

Take a look at the chart below — when you plot the marketing times for houses against the % of asking price that sellers receive in the Lee Davis High School District, you see radical changes in buyer behavior above $500,000. Both marketing times spike and % of ask plummet — effectively saying that the market is substantially less willing to pay more than $500,000 to live in this area of town. And when you creep above $600k, the resistance is even more pronounced.


Lets compare Lee Davis to Midlothian High School — you see a gradual softening in demand become far more pronounced in the middle $500’s.

And finally, to Deep Run High School — you see pretty consistent demand until you reach the $700k mark — at which point demand begins to soften.


As you can see, geography influences caps. Each area has a price above which buyers are hesitant to pay and it can be found by looking for sharp departures in market behavior.

Why Do Caps Matter?

Using the examples above —

  • Would I buy a home for $800k in the Lee Davis HS District? Not if I knew I might need to sell it quickly or in the near future.
  • Would I feel comfortable with spending $200,000 on a renovation on home in Salisbury (Midlothian) that I bought for $400,000? Probably …
  • If I were a builder, would I build 10 new $1M speculative homes in the Deep Run HS District? Nope.

At the end of the day, we all need to be cognizant of where caps exist, if for no other reason than to protect our investment. Just because the home will appraise or just because the ‘per foot’ value seems to be in line does not mean the market will agree when it comes time to put the For Sale sign in the front yard.

Be aware.

We Love Photography

September 13, 2016 By Rick Jarvis

I think that deep down inside, each Realtor is part frustrated architect and part frustrated photographer (ok, this Realtor is) and thus my obsession with extremely well done photography.  Nothing quite lends itself to powerful photography quite like people, nature and architecture.

Being lucky enough to work in a city with architecture dating back centuries, unique shots are everywhere.  And being lucky enough to work with some really talented artists (yes they are artists) only makes our job easier.

Here are some of our favorites.

osrg-couzie_opt

39_e_3rd_st_mls_hid891674_roomfamilyroom1_opt

andrea-office-view-copy_opt

biek-race-lift-web_opt

dinelights_opt

oakpark1_opt

newimg_7643_opt

interior02_opt

byrdpark06_opt

churchhill-11_jpg_opt

grove2_opt

parkave1_opt-1

clarksvilleforgebellonaarsenal7_opt

websize-5

The Affordable Housing Post

March 5, 2016 By Rick Jarvis

theaffordable housingpostIf 2016 is anything like 2015, we are going to see home prices rise.

Nationwide expectations for 2016 predict that home prices are heading up again anywhere from a modest 2% to 5% or more, depending on your market. As the Richmond market tends to fall somewhere in the middle, I think it is safe to say that a nice little 3 to 4% bump in RVA values is probably about right, given no unforeseen changes to housing market inputs.

But if inventory stays tight and rates low, the increase in prices could be larger, especially in the spring.

The Hidden Impact of Higher Home Prices

Now, while prices for houses rising is a good thing for many, for many others, it simply moves the dream of home ownership incrementally further away. Fairly or unfairly, not everyone in the U.S. can afford to own a home — which feels as if it flies in the face of the ‘Homeownership is the American Dream’ sentiment so ingrained in our collective psyches. So making sure enough ‘affordable’ housing is within reach of everyone who seeks it seems like a noble goal for any city.

But affordable is a relative word. For markets like Silicon Valley, Washington DC and New York City, the lack of ‘affordable housing’ is at critical levels and is threatening the health of those regions. Healthy economies require employees that make all salary levels — from CEO’s, bankers and lawyers to teachers, police and wait staff — and when the average wage earners in a region cannot afford the average housing, it is a problem on many levels.

The Richmond VA Metropolitan region has always been a very statistically ‘average’ city when it comes to wages, prices and cost of living — which would lead one to believe that we would not have an affordable housing problem. But is that actually the case?

Below you will find a look at the affordable housing issue in Richmond, from a Realtor’s perspective.

Disclaimer(s)

The discussion of ‘affordable housing’ is a somewhat dangerous one.

The reasons why the market values House A more than House B are infinitely complex. While many of the reasons are due to physical characteristics that are relatively easy to quantify, many other reasons why housing prices vary are far more subtle and frankly, uncomfortable to discuss. Richmond’s most challenging conversations result from biases and prejudices that date back decades, if not longer. Just know that this post is an attempt to help describe the current problem.

Second, I am not a professional economist and I am not a statistician — although I did take (ok, sleep through) several statistics courses in college. I am a life-long Richmond resident and a 20+ year veteran of the real estate industry who loves numbers and loves my home town. So any criticism of any of the conclusions reached here will be happily accepted — I just ask that you are civil and fact-based in your rebuttals.

Finally, and perhaps most importantly, this post focuses exclusively on properties for sale, not properties that are for rent. In the Richmond VA area, roughly 65% of its homes are owner-occupied. Furthermore, the Richmond VA rental market operates largely outside of the Multiple Listing Service and therefore, few firms, if any, specialize in residential tenant representation. So this post is silent to the rental market’s affordability as we simply don’t have access to the data. If that fact alone makes this a flawed discussion, then so be it.

I found a good video that discusses the issues relating to affordable FOR RENT properties prepared by Virginia Housing Development Authority (VHDA.) While our post focuses more on FOR SALE properties, many of the issues are the same, especially those relating to the amount of income that should be dedicated to suitable housing and the percentage of Virginians who spend more than they should have to on their housing. I also found it interesting that the Tidewater region had a bigger number of its residents living with affordability issues than in Northern Virginia. My only guess is that the income disparity was to blame as housing in NOVa is certainly more expensive than in the Norfolk/Hampton Roads region.

The Premise

As a good friend pointed out after reviewing the rough draft, the opening lacked a sort of core premise that one would expect in a post of this scope. Her contention was that the premise only became apparent at the very end (which was a totally fair criticism, by the way) and that the reader would be expecting more direct pathway to a central point.

So if you would prefer a premise, here it is — what you will find below is an exploration of the topic of affordable housing from a REALTOR’s perspective (not from an academic or theoretical perspective,) and an honest attempt to figure out if a) Richmond VA has an ‘affordable’ housing problem and b) if we do, how bad is it and c) what could we do to remedy it?

And with this bit of throat-clearing completed, thus begins the RichmondVAMLS Blog on affordable housing.

The Problem is Not Just About Housing Prices

First, the term ‘affordable housing’ is misleading as it implies that the problem is due to home prices, when it is, in fact, due to many other factors other than just the price of the house.

All of the following have an impact on housing affordability:

  • mortgage lending
  • development costs
  • building codes and zoning
  • proffers
  • tax laws
  • other public policies such as Community Reinvestment Act and Dodd-Frank

Furthermore, the price paid for the home is but one part of the overall cost of ownership and focusing exclusively on price ignores the cost of financing, insurance, utilities, maintenance and replacement of mechanical and structural systems.

Another factor that is hugely important, but extremely difficult to account for, is the location of the housing. A home in the northwestern corner of Hanover County or in deep Chesterfield along the border with Dinwiddie may be extremely affordable, but probably requires a 45 minute drive to any employment center. When the cost of transportation to and from more than offsets any housing savings for the owner, then is the housing truly affordable?

HousingVirginia.org is an awesome resource for all things affordable housing. The sourcebook page offers numerous calculations based on the most recent incomes across the Richmond MSA. They also have a calculation that includes commute times and the impact on housing affordability. Laura Lafayette, CEO of the Richmond Association of Realtors made me aware of this site and the info it provides.

So while all of the factors mentioned above impact the overall housing market, the price of the home bears the brunt of the blame when the topic of affordability comes up. Just keep these points in mind when discussing ‘affordable’ housing.

Defining ‘Affordable Housing’

Any discussion of ‘affordable housing’ needs to begin with a definition of what ‘affordable’ actually means.

According to most definitions, housing is considered ‘affordable’ when it can be acquired by those whose incomes are at or below the median income for the region. In other words, can those who make the median income or less in an area, afford the housing without undue burden? If the answer is yes, then the housing would be considered ‘affordable’ for the region.

Specifically, HUD (The Department of Housing and Urban Development) defines housing as affordable when the cost burden of housing is less than 30% of the household’s gross monthly income. If greater than 30% of the gross monthly income is dedicated to housing expense, the occupant is considered to be ‘cost burdened.’ And while some of us have electively ‘cost burdened’ ourselves with homes that we cannot afford, another large group exists who struggle each and every month to provide the bare minimum of suitable housing for themselves and/or their families.

Housing in RVA vs the U.S.

Home values vary by region of the country — that statement is not a newsflash, I know. The price of a newly constructed 5 bedroom home in a planned neighborhood in suburban New Jersey 30 minutes outside of Manhattan is radically different than the same house in Midlothian, VA.

See below for the median sales price in various Metropolitan Statistical Area (M.S.A.) to get a sense of how different regions across the U.S. are impacted by housing costs. Obviously, the affordable issue can vary greatly depending on where you call home (these statistic were pulled from this report 2015 Median House Values by MSA and from other sources deemed to be reliable):

  • San Francisco CA – $809,000
  • New York City MSA – $408,000 (feels a bit misleading as the overall NYC MSA includes parts of NYC, NJ and PA)
    • Manhattan – $980,000
  • Washington DC Metro – $388,000 (this includes areas as far south as Fredericksburg VA)
    • District of Columbia – $550,000
  • Seattle WA – $386,000
  • Denver CO – $353,000
  • Richmond VA – $231,000

So as you can see, at first glance, Richmond’s affordable housing problem seems to be less severe than many other cities. Housing in Richmond, while not cheap by any stretch, seems to be fairly affordable relative to many regions across the US, and especially to those along the in the Northeast Corridor (DC to Boston.)

House Price Variance in Richmond

Just as pricing differs from NY to NJ to DC, home prices differ from The Fan to Short Pump to Ashland.

As the chart below shows quite vividly, the Richmond region has a high degree of variance in the median sales prices, even in areas in close proximity to one another (the chart below shows the median home prices by common zip code and yes, apparently there was a data issue in the middle 0f 2016):

So when you set off to find that perfect affordable home in Richmond, your success will depend greatly on which of the many sub-markets in Richmond you’re looking in:

  • Trying to find an affordable home in Manakin-Sabot (23103)? Good luck.
  • Want an affordable home in Glen Allen (23059) or Midlothian (23113). Possibly, but it won’t be easy.
  • But are you looking for a house for less than $150,000 off of Jeff Davis Highway (23234)? You will have plenty to choose from.

So just keep in mind, even within what appears to be the same market, a great deal of variance exists and what might be considered affordable on one side of town might not seem nearly as affordable on the other.

This is a screenshot from a heat map showing values across the Richmond region. The heat map combines the highest $/SF AND the highest aggregate prices to give a sense of the geographic value distribution
This is a screenshot from a heat map showing values across the Richmond region. The heat map combines homes that sold for a high price AND a high ‘price per foot’ to give a sense of the geographic value distribution. We used tax data from 2013 to create this so it is a bit dated by now.

Don’t Ignore Income

The cost of housing is only one side of the problem — the other side is income.

The statistic that measures the relative affordability of housing in a M.S.A. is called the ‘Housing Affordability Index.’ Housing affordability is the ratio of income to house price and gives a sense of how challenging it is for people to purchase homes.

562_Bayview_Park_Dr__Milpitas__CA_95035_-_Zillow
This extremely modest 2 bedroom home is located just on the outskirts of San Jose, CA, near Silicon Valley. That is $610/SF for those of you scoring at home.

Below are the median household incomes for each of the MSA’s referenced above (pulled from here):

  • San Francisco CA – $63,024
  • New York City MSA – $59,799
  • Washington DC Metro – $57,291
  • Seattle WA – $50,733
  • Denver CO – $51,088
  • Richmond VA – $46,800 (#29 overall, not too bad and honestly, better than I expected)

So as you can see, when you look at the median pricing of homes and compare it to income, Richmond could have it a lot worse. Can you imagine making even $100,000, living in California’s Silicon Valley and trying to buy a 4 bedroom home with less than a 30 minute commute to Google or Apple’s HQ? Uhhh … no thanks.

A few notes about Median Income — The Median Household Income figure we used is for a single individual. For a family of 4, the median figure rises to just over $70,000. And when you look at Chesterfield versus Henrico versus Richmond City, then the numbers change again. In order to keep this post to a reasonable length, we are using a reasonable approximation of the overall median income figures across the region.

So just count your blessings that the market in which you live is not $700k for 2 bedrooms. And if you are reading this over coffee in San Jose, give us a call! We would LOVE to help you relocate 🙂

Income and the Future

So the RVA Median Household Income is currently $46,800 yet our median home price is $231,000 — which already suggests that median income earners cannot really afford the median-priced home. And even worse, the current ratio of income to home price does not look like it likely to stay at current levels.

Look at the following charts (nationwide median income and local median home prices):

Median Household Income in the United States | FindTheData

As you can see, home prices are rising despite the fact that incomes have remained relatively flat (and yes, I know one chart is national and one is local, sorry, couldn’t find one chart that showed both.) As these lines continue to diverge from one another, the ability for a household earning the median income to buy anything even approaching the median home will continue to decrease. When you factor in the lowest interest rate environment in the last century, this gap is somewhat manageable — but when rates begin to rise (and they will) then we will really begin to see problem grow.

At some point, something has to give.

Defining RVA Affordable

So in order to take on the discussion of affordable housing, we need to define what makes a home ‘affordable’ in our marketplace. And in order to establish the price of a home that would be considered ‘affordable,’ we need to start with how much income is required to purchase a home.

In the statistician’s minds, a home is affordable if it can be acquired by a household making an income that is is either at or below the median income level in the region. For Richmond, the median income is $46,800 annually.

Ok, if you earned the median income of $46,800, what is the maximum you can afford?

According to Chris Owens with Southern Trust, a person (or couple) earning $46,800, using the maximum debt amount and minimal down payment programs (VA/FHA/VHDA,) would be able to secure a loan amount between $170,000 and $180,000, given current interest rates (right now hovering around 4% in March of 2016).

  • At a salary of $40,000, the mortgage drops to closer to $150,000
  • And if interest rates rise by a 1%, the borrower loses roughly $10,000 to $12,000 in buying power.

So for the sake of argument, we can assume that in Richmond VA and the surrounding area, a home price of between $150,000 and $180,000 would be considered ‘affordable’ in our current income and interest rate environment.

Chris Owens at Southern Trust
Might want to give these guys a call. They a wide range of mortgage products and can accommodate all types of buyer profiles.

Mortgage Qualification

Odds are, if you are buying an ‘affordable’ home, you are going to borrow money to purchase the home.

Borrowing money = obtaining a mortgage.

Obtaining a mortgage means you are going to be subject to the rules of the mortgage industry. Simply stated, if you want their money, you have to follow their guidelines. And for those who have been through the process, it can feel overly complex, totally invasive and generally pretty ridiculous, especially when you are on the margin of qualifying.

You will see me refer to buyers ‘at the margin‘ throughout this post. What I am referring to is buyers who make just enough income to qualify or those who have just enough cash for a down payment or even those whose credit scores are barely above the stated minimum for the programs they are qualifying for. I am using the word ‘margin’ in an economic manner, and not a pejorative one.

Generally speaking, most mortgage companies will underwrite purchasers in the following manner – roughly 30% of your gross monthly income can be applied towards a mortgage payment that includes principle, interest, taxes and insurance — provided the sum total of the purchaser’s monthly obligations does not exceed 40-45% of their income (and in some cases, this ratio can exceed 50%.) The relationship of income to debts is often referred to as the ‘Qualifying Ratio’ and will vary by loan type and to some extent, region of the country.

You can read more about qualifying ratios here.

Loan Products and Affordable Housing

Now, there are many different mortgage programs that are available to purchasers and each one occupies a slightly different space on the mortgage spectrum.

Fannie Mae and Freddie Mac probably are better options for those purchasing homes in the middle to upper price ranges, provided the buyers have the necessary down payments to qualify. The loan programs provided by FHA (or VA) tend to offer the best options for buyers who are buying with either lower credit scores, the bare minimum of income and/or cash. And it should be noted that different mortgage companies will also interpret guidelines differently, which can add to the confusion.

Furthermore, there are often grant programs that offer down payment assistance to buyers who lack the necessary funds to purchase a home. These down payment assistance programs tend to be funded at different times during the year and will periodically run out of cash. This fact alone can make the use of the DPA programs a little challenging as bad timing means no available cash — so be wary.

Again, each grant program, just like each loan program, has a different set of guidelines so qualifying for one may differ from qualifying for another.

As a side note, most mortgage lenders, like any industry (Realtors, mechanics, doctors, teachers) tend to specialize. Certain loan officers tend to be more fluent in the affordable mortgage products than others. Do your homework on your lender, especially when applying for grant money, as the strings attached to DPA programs are many and failure to meet a seemingly benign requirement can disqualify the applicant from receiving the grant.

Needless to say, the mortgage process can seem extremely daunting, especially for those who have never been the underwriting process. But while the mortgage process may seem extremely complex, it is not unfair, and if anything, skewed to helping those with little to no cash be able to purchase housing. So when I see politicians perpetuating the myth that ownership of real estate is somehow reserved for the elite, I get extremely frustrated because it is simply not true.

Inventory, Competitive Offers and Affordable Housing

Unless you have been living on Mars since about 2010, you are aware of the housing inventory shortage.

The supply of homes is at an all time low which is creating extremely competitive market conditions. The large majority of homes, especially homes that are well built, well located, well cared for and well priced are selling at or near full price, often times with multiple offers and/or outright bidding wars. Consequently, sellers are demanding quick closings and often refusing to do any repairs.

Needless to say, these market conditions do not favor the affordable buyer.

The chart above shows the number of available homes in any given month going back 10 years. As you can see, from the height to the bottom, the supply of available homes has fallen significantly. Economics 101 states that when you restrict supply, prices tend to rise. While this supply issue impacts all housing at all price points, it is extremely impactful on the buyers of affordable housing … and not in a good way.

The Competitive Bid Scenario

In a competitive bid situation (when two or more buyers submit an offer on a home,) sellers invariably look at the financial strength of the buyer and tend to choose the one with the best financial profile.

The mortgage programs that are most commonly used by first time affordable buyers (or buyers at the margin) are FHA, VA, VHDA or some other type of low cash downpayment loans. As a seller, if I have two buyers who have offered me a similar price and terms, but one is using an FHA loan with the maximum loan amount (96.5%) and the other buyer is putting 10% down and using Fannie Mae, I would choose the Fannie Mae buyer every time. Or as this article points out, cash buyers looking for investment property can also interfere with affordable purchasers acquiring affordable homes.

So the loan products typically used by ‘affordable’ buyers often put them at a disadvantage in any competitive bid situation. And in the current market conditions, the best homes frequently end up with multiple offers.

Affordable Loans Take Longer

Similarly, many of the Down Payment Assistance programs take longer to underwrite, extending the time between when a buyer can contract a home and settle on it. Again, in cases when a quick closing is either required or preferred, this puts the affordable buyer at a competitive disadvantage.

Ironically, one of the primary considerations for banks and other financial institutions who were attempting to liquidate foreclosure inventory was time. Given two offers, banks would often choose the quicker closing at a lower price over the slower closing at a higher price. Again, this practice hurt the affordable buyer’s ability to acquire properties at foreclosure discounts.

Appraisal Risk

Loans that are highly leveraged (VA allows 100% loan amounts and FHA allows 96.5%) are extremely vulnerable to appraisal —  and if  you are getting a mortgage, especially an FHA or VA loan, an appraisal is required.

The appraisal is an ‘independent’ 3rd party opinion of value based on past sales of comparable houses. The mortgage company uses the appraisal to set the value from which they compute the loan amount. And when a bank sets the loan amount, they use the appraised value of the home or the purchase price — whichever is LOWER.

If the appraisal comes in below the sales price, which is a far more common occurrence in accelerating markets (and trust me, we are in an accelerating market right now,) the deal often dies as the buyer does not have the additional funds required to make up the difference between the appraised amount and the sale price. In other words, if the contract price for the home is $150,000 and the appraisal values the property at $145,000, it is incumbent on the borrower to make up the difference. If you are stretched to come up with 3.5% in down payment, finding an extra $5,000 in cash is probably not available and thus, the loan is denied. This scenario plays out every day multiple times and it is unfortunate as it is frustrating for all parties in the transaction.

Inspections and FHA Appraisals

And finally, the stock of housing in Richmond that trades in the affordable prince ranges tends to be older. As we will discuss in a later section, older homes invariably have more issues related to wood rot, mechanical systems nearing the end of their useful lives and roofs that could begin to fail any day. Any buyer with limited reserves purchasing a home that will soon need thousands in repairs is risky.

And in an attempt to prevent this, FHA and VA appraisals now require the appraiser to note the age of the roof, any chipping paint and several other items that, if found, require the seller to repair prior to closing. More than a few deals have fallen apart due to a VA or FHA appraisal making note of required repairs that a seller was either unable to unwilling to complete. And we have even begun to see some sellers refuse to consider offers where FHA financing is involved due to the the risk of loan denial based on appraisal.

Effectively, the controls put in place to help protect the affordable buyer often times have the exact opposite impact. The more requirements that need to be met for loan approval relating to property condition, the higher the likelihood of loan denial for reasons NOT related to income, job history, credit score or available cash for down payment.

Summary

So while there are many great loan products designed to help buyers at the margin purchase homes, existing market conditions combined with more restrictive loan structures tend to work against the very buyers these loans were designed to help.

School Districts and Affordable Housing

So while it is one thing to look at the supply of affordable housing in the region — it is quite another to look at the supply of affordable housing in the region’s most highly rated school systems.

For each of us, how we feel as parents about our child’s education differs greatly. Some value subject matter (math/science over liberal arts) while some value diversity (or a lack thereof.) Some parents value a school’s athletic programs or practice facilities while still others feel the age of the school is important. Some value class size and others value the technology in the classroom … the list goes on and on.

Regardless, if you are a parent and wish to provide your child with the best public education experience you can provide them with (however you choose to define ‘best’), what are your options? Are they equal? Do the tax dollars paid in Eastern Henrico provide the same public school experience as those in Western Henrico? Do you really have access to the ‘best’ school districts if you earn $50,000 per year?

So for this discussion we are going to focus on the access to affordable housing as it relates to access to above average public education. Stated differently, what is the availability of housing for those who are at or near the median income AND fall within one of the better public school districts in the Metro area?

GreatSchools.net 

So how do you define ‘above average’ public schools? That is a really tough question as everyone will answer this question differently.

One of the most common platforms for school comparison is GreatSchools.net. While far from perfect, GreatSchools.net is probably the best resource for comparing schools across a region and thus, was used to establish which schools we included in our analysis. Now the rating method by Great Schools is another debate for another day, but as one of the most widely used school rating systems, it is all we have at our disposal.

The_GreatSchools_Rating___GreatSchools
This screenshot is pulled directly from the GreatSchools.net page where they discuss how they rate schools. Clicking the image will take you directly to the page for more depth on how their ratings are computed.

Schools, Scores and Values

To understand home values in Richmond is to understand the ‘perceived’ value of the public education in each school district.

While all of the counties in the Metro (Henrico, Hanover, Chesterfield, Powhatan, Goochland, New Kent and the City of Richmond) offer public education to its residents, each of the school districts differ in age of facilities, programs, teacher experience, test scores and of course, ratings.

If you ask 10 people about their opinions of the high school districts, they will offer at least 10 different opinions about their preference for a district, if not more. Some of these opinions are well informed and some, well, not so much. Regardless, the large majority of buyers, when looking for housing, will use school districts as an integral part of their search criteria.

When you begin to examine the impact of school district on pricing, you see almost exactly what you would expect — the highest priced homes in the Metro are generally located within the highest rated school districts, at least in suburban Richmond. Within the Richmond City limits, this school/value correlation exists more at the elementary level.

So How Do Ratings Impact Values?

The results are as you would probably expect (using median sales data from the CVRMLS from April 2015 to March of 2016) for homes in the suburban marketplace:

  • Homes in the Deep Run High School District, rated 9 of 10 by GreatSchools.net, had a median sales price of $534,000, spent 25 days on the market and sold at $149/SF.
  • Homes in the Atlee High School District, rated 8 of 10 by GreatSchools.net, had a median sales price of $295,000, spent 20 days on the market and sold at $122/SF.
  • Homes in the Monacan High School District, rated 6 of 10 by GreatSchools.net, had a median sales price of $199,950, spent 23 days on the market and sold at $106/SF.
  • Homes in the Meadowbrook High School District, rated 4 of 10 by GreatSchools.net, had a median sales price of $159,000, spent 26 days on the market and sold at $92/SF.
  • Homes in the Varina High School District, rated 2 of 10 by GreatSchools.net, had a median sales price of $169,000, spent 31 days on the market and sold at $96/SF.

When you move into the City of Richmond, high schools no longer are the predictors — the elementary schools are:

  • Homes in the Armstrong HIGH School District, rated 1 of 10 by GreatSchools.net, had a median sales price of $132,950, spent 27 days on the market and sold at $87/SF.
  • Homes in the Thomas Jefferson HIGH School District, rated 2 of 10 by GreatSchools.net, had a median sales price of $332,000, spent only 10 days on the market and sold at a very high $191/SF.
  • Homes in the William Fox ELEMENTARY School District, rated 7 of 10 by GreatSchools.net, had a median sales price of $450,000, spent a mere 9 days on the market and sold at a whopping $203/SF.
  • Homes in the Mary Munford ELEMENTARY School District, rated 9 of 10 by GreatSchools.net, had a median sales price of $350,000, spent a mere 9 days on the market and sold at a whopping $200/SF.

And yes, both Fox and Mary Munford feed directly into Thomas Jefferson High School while a collection of elementary schools with far lower ratings feed Armstrong. And if you want to explore more homes for sale, we break it down by High School District on our page dedicated to moving to Richmond called ‘The Ultimate Relocation Guide.’

So the reputation of the school, either real or perceived, seemingly has a huge impact on home pricing.

Affordable and Close In

Buyer: “I want to buy something ‘close in'”
Agent: “Close in to what?”

Words like ‘close’ or ‘nice’ or ‘good’ are incredibly subjective words and mean different things to different people. So describing a home as ‘close in’ really needs to be followed with ‘to what?’ in order to have any real meaning. Do you want to be in close proximity to Downtown? Innsbrook? Bus routes? The train station? Shopping? The VA Hospital? Chester? Ashland?

As my friend Helen Hardiman of H.O.M.E. rightly points out, a home is not nearly as affordable if it is located 30+ minutes from schools, employment centers and other basic services. Saving $500 per month in mortgage payment only to spend $600 in gas and automobile wear and tear is a poor trade. Additionally, many do rely on the public transportation network and finding suitable ‘affordable’ options near the nodes of public transportation is a real challenge.

So in 2015, counting houses with 3+ bedrooms, 2+ baths and located in a High School District rated 6 of better by GreatSchools.net:

  • 764 homes sold within a 20 mile radius of City Hall
  • 646 homes sold within a 15 mile radius of City Hall
  • 343 homes sold within a 10 mile radius of City Hall
  • 87 homes sold within a 7 mile radius of City Hall

Now, this number is somewhat skewed by the fact that ratings of the City of Richmond public high schools are less than 6, but it also drives home the point that the intersection of affordability, the best public education and public transportation is narrow indeed — and I am not sure what can be done as long as we have the issues we do with public education in the City of Richmond.

Without a doubt, the public education challenges we face in Richmond are our region’s biggest issue for the foreseeable future and its impact spills over into many of our most troublesome issues — including affordable housing.

Mapping Affordable Housing

The map you see below shows all of the housing in the region priced between $150,000 and $180,000.

It does not take into account any factors beyond price. More specific lists are below, but this search just shows the location of the ‘affordable’ housing without regard for any features such as a size, age, bedrooms, baths, condition or school district.


So What Does the Sales Distribution Look Like?

In 2015 alone, over 5,000 homes were sold below $180,000 in the Richmond region. From an ‘affordable’ standpoint, that is pretty good.

And as you can see by the table to the right, there have been 30,000+ homes sold in the past 5 years below $200,000. Furthermore, the largest percentage of homes sold in the Richmond region fall between $150,000 and $200,000. So finding a home in Richmond for less than $200,000 seems to be rather doable.

Now, can you find 3,800 SF 5 bedroom brick colonial built in 2005 situated on 3 acres with paved drive and swimming pool overlooking the James River for $199,950? No, obviously not (but you might be able to find one for closer to $1M if you look here!)

In the past 5 years, the number of homes sold below $200,000 is basically equal to the number sold above.
From 2010 through 2015, the number of homes sold below $200,000 is basically equal to the number sold above. Statistics pulled from MLS

But can you find a home in one of the more highly rated schools in the Metro for under $200,000? Yes.

How about $175,000? Yes.

How about $150,000? Maybe, but your options begin to get pretty thin.

But you can see for yourself. The list below is a sample of homes available with at least 3 bedrooms and at least 2 baths for less than $180,000 in high school district rated at least 6 or more by GreatSchools.net.


As you can see, if you were heading out tomorrow to look at houses between $150k and $180k in a better than average high school district, you would find many that are available.

Are they all located along Monument Avenue or within sight of the James River? No, not at all.

But are they located within a 30 minutes drive to the City? Not all are, but many are …

Obviously, our problem feels less severe than the some of the other cities mentioned above.

So There’s No Problem, Right?

Uhhh … I don’t think that is the correct answer, either. Just because a home is deemed affordable does not mean it is well built, well maintained or without other flaws.

Unfortunately, a great deal of the housing that exists in the better school districts that is ‘affordable’ does have issues. An HVAC unit on its last leg or a roof with 2 years remaining on its useful life falsely deflates the price, but not the cost of ownership. If anything, substantial deferred maintenance items are a ticking time bomb for buyers stretching to afford the homes they purchase. Other times, factors such as proximity to a highly trafficked road or other nuisances (power lines, commercial properties or industrial facilities) may drive down the price of the home and be extremely detrimental to the long term potential appreciation.

So once again (recurring theme alert) — focusing exclusively on price does not fairly portray the problem.

Construction Quality and Useful Life

Construction quality varies by era.

Construction in our region, especially in the period beginning in the later 1970’s and into the 1980’s, is not nearly as robust as it should be. The advent of vinyls and other ‘engineered’ products (like composite siding) in the middle/late 1970’s began to change how homes were built and how long they were designed to last.

By the early 1980’s, builders had largely gotten away from brick exteriors, HARD wood trim and floors of the late 1950’s and 1960’s and began to introduce composite materials, vinyl flooring and far softer woods. In an attempt to build homes faster and for less money, we allowed an entire generation of housing stock to be built whose effective life had shrunk from 50 years or more to less than 20. A house built in 1985 is now 30+ years old and, as almost any home inspector will tell you, the list of repairs is always long and generally expensive.

So seeing a client stretching to the most extreme levels of qualification and liquidating the majority of their savings faced with multi-thousand dollar repairs shortly after possession is painful for anyone in our business. As a matter of a fact, one of the best books recently written about housing, entitled Zillow Talk, makes some excellent points about ‘affordable’ housing and questions whether incentivizing home ownership for the marginal buyer is actually a good thing. One of the reasons, among many, is how the burden of maintenance can disproportionately impact a home owner with low reserves.

NEW Affordable Housing

So if we don’t want our affordable homes to be maintenance nightmares, then lets just go ahead and build some new ones and the issue is solved, right?!?

Yeah … that won’t work.

In 2015, there were 471 homes sold (thru MLS) in the high school districts from above (Great Schools 6+) priced between $125,000 and $180,000.

Care to guess how many of these sales were new homes? A mere 3 of the sales were of NEW homes.

SO TO REITERATE — IN 2015, ONLY 3 OF THE NEARLY 500 AFFORDABLE SALES IN GOOD SCHOOL DISTRICTS WERE NEW HOMES!!!

Yep … three. Tres. Trio. Tifecta. Trois.

That IS a problem.

Ok then — of the 471 homes sold, what were their characteristics on the average?

  • 3 bedrooms
  • 2 baths
  • 1,530 SF
  • $111/SF Sale Price
  • Built in 1971

Again, the average age of an affordable home, in an above average school district, is 45 years old. Yep, that’s right — FORTY FIVE YEARS OLD — and just to add some context, when you look at the average sales price of any new home in these school districts, you can find 737 sales at a median value of $430,000.

Those statistics seem badly out of balance.

Wait, What?!? Why Can’t We Build a Remotely Affordable New Home?

So of the nearly 500 sales referenced above, only 3 were new … why? Why can we not build a new home that is considered within reach of the affordable segment of the marketplace? The reasons are many, and unfortunately, they are not only incredibly complex, they are highly unlikely to get any better any time in the foreseeable future.

The Actual Cost of Building 

Sorry, time for some math.

Depending on the level of home you are looking to build (wood floors versus carpet/laminate tops versus granite/20, 30 or 50 year roof/fireplace or not/garage or not) you can spend anywhere from about $70 per square foot for the most basic of houses to well over $150 per square foot. Every component to a new home has an associated cost and any number of seemingly benign factors from site work to tree removal to driveway length can impact pricing significantly. And understand that we are only talking about the construction costs, not land cost.

So if we choose a relatively affordable $80/SF, quick math tells us that a home of 1,500 SF would cost roughly $120,000. In 1,500 SF, you can fit 3 bedrooms and 2 baths along with a decent sized kitchen and family room, but not much more. Now, in the $80/SF cost of the 1,500 SF home from above is simply the sticks, bricks and people to put it together, along with the cost of the plans, permits and interest on the money borrowed to construct the home. Again, this $80 figure does not include the land nor does include the commissions.

So when you add in a lot upon which to build (if you get lucky, you might find a spare lot for $40k to 50k, but the far more likely price is $60k up to $200k in the newly developed communities) and the commission to pay those greedy agents (5-6%), you find yourself with costs approaching anywhere from $200,000 to $220,000. And just a reminder — this is the COST to build a home and does not include profit to the builder. So providing any new home to the market below the middle $200’s in Richmond VA is a challenge.

MLS seems to agree with this analysis (this is a list of the least expensive new homes in RVA in 6+ school districts):


So as you can see, the ability to provide a newly constructed home in the better school districts of Richmond is extremely limited. And even if you look at the homes above, many are ‘to be built’ (not actually built) and thus the pricing tends to rise quickly when many of the items a buyer assumes would be included turn out to be upgrades.

Sorry, but the math is the math.

Government Mandates

The government has a lot to do with housing — and when I say ‘government,’ I mean all layers of government, from our friends in DC to the Virginia State Legislature to the local board of supervisors charged with approving (or killing) development plans.

Even at the most local of levels, government has its say as code enforcement officials have the power to stop housing in its tracks if they choose not to issue the multiple permits required for a builder to obtain the final ‘Certificate of Occupancy’ for a closing. And there is no real recourse for the home builder to contest code issues in any sort of a timely manner. Ask any seasoned builder if the local building inspector has ever impacted their ability to get a C.O. for a questionable reason … they will all nod their heads and begin to turn shades of red.

A few examples of how government regulation has impacted the pricing of houses, regardless of the original intent of the legislation, are below:

  • The Dodd Frank Financial Reform Act of 2010 added nearly $200 per transaction in compliance expense (according to recent study) to each mortgage. This cost is simply passed on to the borrower.
  • In 2012, the Federal Government enacted legislation that mandated mechanical systems improve their energy performance by 30%. While this is probably a good thing in the long run, mandating more efficient systems meant mandating more EXPENSIVE systems … this is not helpful to the affordable issue.
  • Counties collect cash ‘proffers’ on all new homes built. Chesterfield County, for example, collects $18k on each new home built. These costs are passed on to the buyers and on a $200,000 home, that is close to a 10% increase in price.

So when we hear the politicians complain about the problem of housing affordability, they are often times contradicting the very policies that they helped enact.

Anti-Affordable Bias, the Uncomfortable Discussion

Have you ever been to your local courthouse and listened to citizens weigh in on a rezoning case for a large development? Not pleasant, is it.

And have you ever had the pleasure of attending a public hearing where there was mention of the term ‘affordable housing’ in the proposed development? Oh my — talk about bringing out the worst in human nature. It is shameful.

The pressure on local governments from its citizens to NOT allow any form of affordable housing within its borders is intense. It is not a secret that the term ‘affordable housing’ has a very negative connotation in the minds of many and despite efforts to rebrand ‘affordable housing’ to ‘workforce housing’ or ‘mixed-income’ housing, it still draws the ire of nearby residents (few understand the difference that housing considered ‘affordable‘ and housing considered ‘subsidized‘ are two entirely different animals, but that is another post for another day.) Supervisors are trapped between trying to honor the collective will of their constituents and providing a balanced housing solution for the future.

Now, to say that new development has no impact on a city or county is naive. New residential developments impact roads, schools, emergency response, libraries, greens spaces and just about every conceivable service a county or city can provide. So when citizens voice concerns that a new development is adversely impacting existing services, it is a legitimate beef. But when citizens use these legitimate arguments to veil their biases about ‘affordable’ housing, it is not only sad, but perpetuates unsound policy.

So what does the local board of supervisors do to try to help the problem? Not much, typically. If anything, they enact policies that make affordability impossible. Municipalities have the ability to influence the price of housing in many ways — from minimum lot widths (to decrease density and drive up land costs) to premium material requirements (to artificially increase prices) to cash proffers (to again, artificially drive up prices) — and in doing so, can effectively make it economically impossible for an ‘affordable’ house to be constructed within their borders.

Do we all want housing to be less expensive? Sure.
But do we want it to be cheap? Nope.
And do we want it in our own back yards? H*** No!

Everything is Intertwined

One of the reasons that we spend so much time with housing prices is that prices are specific data points that lend themselves to relatively easy analysis. With all of the housing sales data we have at our fingertips, examining home prices and trying to create balance between supply and demand at different price points is not an impossible task. So when we attempt to force more affordable homes into the market, are we really fixing the root cause?

In many ways, our efforts to create affordable housing is a backwards approach. We spend far more time trying to create more affordable housing through incentives than we do in investing in the systems that create a more qualified buyer pool. It is far easier (and faster) to try to bring the price of a home down with an incentive than the income required to purchase it up.  While we blame the cost of housing for the problem, in reality, the real problem is the limited earning potential of the individuals who seek ownership.

So when we talk about certain areas having too little affordable housing while others having way too much, it is usually due to societal issues that require generations to truly fix. Creating an incentive for a developer to build a certain percentage of homes in an ‘affordable’ manner is helpful in the short term, but the far greater payoff is when quality education is ubiquitous and poverty decentralized. So until we address the underlying causes of why a house in the Varina High School District trades at a 40-50% discount to the same home in the Glen Allen High School District, we are just treating the symptoms while we are ignoring the illness.

Almost Done — One Final Thought

Realtors are commissioned sales people. In other words, we make no money if we have no sales.

And now layer on top of that fact that we actually work with no guarantee that our work will actually ever be paid. No one in their right mind should work under those conditions. I guess that tells you a lot about Realtors, but I digress.

So when you combine a lack of inventory and a buyer pool with less cash, lower incomes and more hoops they have to jump through, you begin to see quite quickly that the hourly rate agents work for goes down substantially at the lower price points.

And much like the pressure on the homebuilders that we discussed earlier, the cost pressure on agents is increasing as well. Our E & O Insurance, our board dues, lockbox keys, smart phones, our web and other technology expenses, Zillow and Trulia, gasoline, photography — they are all more expensive than our predecessors. And the paperwork now required (mostly due to multiple disclosures and disclaimers) to successfully make an offer is roughly 3x what it was when I first entered the business (and this holds true for our mortgage lender brethren as well.) The level of documentation now required for every contract is far greater than it has ever been — and it is not getting better.

Am I looking for sympathy? No. But I do want those who think that the Realtor lifestyle is one of luxury, then I encourage you to get your license and see the hours we work relative to the pay. I think I speak for my peers when I say that being an agent is a lot harder than it looks.

Effectively, the pressure for agents to become more efficient with their time has never been greater and, therefore, I see many agents attempting to move into market segments where the pricing is higher, the hours required to make a sale are shorter and the likelihood of loan denial is lower (for the reasons referenced above in the mortgage discussion.) And unfortunately, these economic realities come at the expense of the service level feasibly offered to the affordable buyer.

Imagine the scenario, if you had an hour to spend and could only work with one client, what would you do?

  • Client A has a 90% chance of generating a $15,000 commission
  • Client B has a 60% chance of generating a $7,000 commission

I think the answer is unfortunately obvious.

I have discussed this very point with my friend referenced above, Helen Hardiman with HOME (Housing Opportunities Made Equal.) It would be rather easy to create a more levelized commission structure to encourage more experienced agents to work the affordable market segment by using the greatest of all incentives — taxes. By either fully (or partially) waiving income tax due on any commission for a home sale at or below the median level (and the same can hold true for homebuilders) you would see more and more experienced agents (and builders) allocating time to working in what had previously been a less profitable segment. Reducing taxes due on any aspect of brokerage, borrowing or home building would help greatly — but that is another post for another time.

Most good agents will show each and every client the respect they deserve, regardless of the expected price point. But until the market somehow becomes far more efficient below median price points, I fear that overall, the affordable buyer will struggle to receive the same attention that the higher price point buyers receive.

Summary

So here we are.

Do I think we have a problem with affordable housing? The answer really depends on how you to choose define ‘affordable’ and how you choose to define ‘problem.’

  • Do we lack a supply of homes in our region below $180,000? No, we do not — at least for the moment.
  • Do we lack a supply of homes in our region below $180,000 that are in better than average school districts? Maybe, but it is not at a crisis level.
  • Do we lack a supply of NEW homes in our region below $180,000 that are in better than average school districts? Without a doubt.
  • Do we lack a supply of homes in our region below $180,000 that are either ‘close-in’ or within walking distance to public transportation? Maybe, but it isn’t critical — until you try to find them in above average school districts.
  • Do we have loan programs designed to help buyers acquire affordable housing? Absolutely.
  • But do the loans we have in place for the affordable buyer work as intended? Given the hyper-competitive environment we are in, not really.
  • Is the affordable problem going to get better or worse in the coming years? I fear it will become worse.
  • Are we doing anything about the issue? Not as far as I can tell.

At the end of the day, despite our collective belief that home ownership is the ultimate in private ownership and self-determination, housing is an extremely regulated and influenced industry. At every level — mortgage, taxation, building codes, zoning and development — governmental influence and control is prevalent. So when I hear our elected officials complaining about how expensive housing has become, or how biased it is against certain groups, I get pretty annoyed because they need to look no further than their own policies to find the reasons why.

Ownership is often seen as a rite of passage and one of the key steps in breaking the cycle of poverty. Unfortunately, ownership is a far greater financial responsibility than renting and assuming that owning a house is a risk-free pathway to financial independence is simply not true.

Our leaders far too often paint the picture that home ownership will somehow magically create wealth — and it is a dangerous message. Encouraging everyone at the margin to strive for ownership makes for great speeches and is sure to gain applause, but is responsible? I believe it not to be.

Simply put, when pride of ownership becomes the burden of ownership, no one wins — and I don’t think the goal of affordable housing should be to place those with the least ability to withstand a financial emergency in an economically precarious position. When an industry is as dependent upon Washington, DC as housing is, even the slightest policy shift can swing home values greatly. When values shift, those who have fewer reserves, less equity and lower job security are the most vulnerable and we need to extremely careful of placing risk on those who can least afford it — as 2008-12 so vividly demonstrated to us all.

Politics aside, it feels to me that we (Richmond) don’t have an affordable housing problem in the way that we see other market’s affordable housing problem portrayed on CNN and MSNBC. And while I would not say that we are without issues, our issues seem far more manageable than the larger markets nearby.

So while our problem feels smaller than their problem, just remember that their problems used to be a lot smaller, too, until they weren’t. When we ignore the issues, we do so at our own peril and while our affordable housing problem is not our biggest problem — yet — the stage is set for it to not only become far more problematic in the near future, but far harder to cure as well.

Renewing Old Urbanism

September 25, 2015 By Rick Jarvis

Walking is a foundation of new urbanism. But you know what, walking has always been the foundation of old urbanism.

Urban Renewal and Richmond

As the development momentum of Richmond gained steam in the late 1990’s and into the 2000’s, the planners at City Hall began to mandate that the developers adopt a mixed-use model for their projects. Dedicating spaces along the street for commercial uses (instead of residential ones) became the requirement. It was not exactly embraced by the development community as commercial office and retail was harder to lease than the residential spaces.

decatur living room
The Decatur project in Manchester is about as amazing of a space as there is in Richmond. The project consists of three residential condos and one commercial one.

Why? Demand for residential space far exceeded the demand for urban commercial spaces, especially during the years following the crash of 2008. For several years, vacancy in the street level commercial spaces was extremely high and developers fought to build a little as possible as it was not only hard to lease but hard to keep leased.

The Impact of Mixed-Use Today

Was street-level commercial the correct development model for Richmond? While the mandate to build commercial spaces during the recession was met with resistance, it seems to now be paying dividends. Far more start-ups, pop-ups, cafes, restaurants and galleries have begun to fill these spaces and is creating the vibrant street life that RVA lacked for decades.

Given time and a better economy, mixed-use seems to have been the right path.

The Quirk Hotel, opened in September of 2015, is yet another transformative project in Richmond's historic Downtown.
The stunning Quirk Hotel, opened in September of 2015 by Ted and Katie Ukrop, is yet another transformative project helping redefine Richmond’s historic Broad Street corridor.

So Why Mixed-Use?

In theory, placing commerce spaces in proximity to living spaces reduces the need for automobiles and fosters a neighborhood’s micro-economy. When done right, neighborhoods to develop their own ecosystem and move towards a harmonious balance of live-work. So when there’s a deli downstairs, right next to the dry cleaner and down the block from a wine store, people don’t have to jump into the car so much to get stuff done … and the idea of supporting the local shopkeeper is, on its own, a cool thing, too.

So is it Time to Lease or Buy?

And yes, we are still in recovery from the crisis of 2008-11, but it is far better than the darkest days. There’s still an excess of retail space in some zones, but nearly not at the same levels as just a few years prior.

Huntt's Row is a series of 8 townhouses in the Fan District that will be coming on line in the late Spring of 2016
Huntt’s Row is a series of 8 townhouses in the Fan District that will be coming on line in the late Spring of 2016. Click the image to learn more.

Potential office/retail lessees/purchasers are still in a pretty good position right now, but free rent and below market build-outs are far less common than before. And where tenants of 2010 used to find 10 -15 great options, tenants today now only find a handful. Same with the buyers.

One South's new office was built in the bones of a historic warehouse in the Fan District. Did I mention we won an award for it?
One South’s new office was built in the bones of a historic warehouse in the Fan District. Did I mention we won an award for it?

Residentially, from the Fan and Museum District to Jackson Ward, Shockoe, and Manchester, many areas are again seeing pricing at or above the 2007 peak … and if 2016’s spring is anything like the last two, it will go even higher. Inventory is still down and rates are still at or near historic lows.

Downtown and Bikes

Personally, I loved the energy from the bike race.

bike race
This photo was taken from in front of Lift Cafe along Broad Street. The level of energy and life brought by the race from Richmonder’s and non-Richmonders alike was unlike anything I had ever experienced.

While different perspectives exist as to its importance and its impact, there is no doubt that the UCI Championships gave incredible exposure to the city and placed it in an extremely positive light. Hopefully, not just the international community walked away with a positive feeling about Richmond, but so did many of Richmond’s own non-believers.  The Downtown that many remember as ignored, blighted and lifeless is now quite the opposite. I think the 600k people that attended can attest to that fact.

A Great Environment

Give the idea of investing in Richmond, either residentially or commercially (or BOTH!), serious consideration.

These prime conditions should help illuminate an oft-ignored consideration in the purchase decision matrix: investing in interesting space in a vibrant and emerging neighborhood helps attract and retain talent for the business you’re starting or expanding. And better personnel translates into a fatter bottom line.

Most understand the value of owing housing but don’t ignore the possibility of owning your own business space. You’ve already taken the leap of starting a business. Doubling down with real estate might be the best bet you could make.

Quick and Dirty Real Estate Math

September 24, 2015 By Rick Jarvis

Time is money—no question that that is about as cliché as it gets. But it also happens to be true, especially in real estate. That’s why the ability to do a “quick and dirty” analysis of a transaction is absolutely critical. If you abide by some basic “rules of the game,” you can quickly identify the bad deals from the good and reduce your exposure to mistakes.

null_png

Here are some of those rules of the game that experienced Realtors use every day:

The New Home Premium

This one is a must for builders—whether they’re pricing homes for sale or gauging whether to purchase buildable lots. Certainly construction costs are a fundamental input to pricing, but a good builder always has an acute sense of a given market’s desire for new housing over existing housing. Put another way: how much will a buyer pay own a new home versus an existing one? If a relatively similar brand-new home and a 10-year-old home are both priced at $400,000, a buyer will almost always choose the new one. But can the builder charge more for the new home—and how much? $20,000 more? $40,000?? $60,000??? This is what we had to figure out when we were pricing the Citizen 6 Project on Floyd Avenue and the Tribeca Brownstones in Randolph.

Homes in the Citizen 6 infill project were both tricky to price and tricky for the appraisers.

But understanding how tocalculate this premium isn’t useful just for builders. A buyer is better equipped if he or she understands this calculation as well. Depending on the age of the home, the location, and the number of new homes available, a new home premium can fall anywhere between 7-20 percent (read more about thing you should know when building a home.) In neighborhoods that are somewhat starved of new homes, the premium can go even higher. On the other hand, if an existing home is still pretty new—say, fewer than three years old—the premium will shrink. This can help in areas that might have lots of new housing nearby.

The ‘Lot to Improvement’ Ratio

The ratio of “lot to improvement” is really the percentage of the total value of the property that belongs to the land. Stated another way, how much of the TOTAL value of a property is in the land and how much is in the house? In the Richmond metro area, land value usually hovers between 20-30 percent of a property’s total market value…meaning that a home whose price is $500,000 is built on a lot whose value is roughly $100,000 to $150,000. Naturally, this is not a fixed ratio. A home’s age and neighborhood quality will affect this ratio. But when you’re talking about a consistent type of housing in a relatively young neighborhood, perhaps around 20 years old, this measurement is pretty reliable.

A distribution showing the age of homes across the region. Kinda cool, no?
A heat mapped distribution of the age of homes across the region. Kinda cool, no?

Before you make this a true rule of thumb, understand that it’s a hyper-local calculation. Different regions can have radically different ratios for any number of reasons. Look at the Washington, DC, metro area: land value approaches 50 percent in many neighborhoods. In the Outer Banks, especially along the ocean, you’ll see ratios climb even higher. Interestingly, Charlotte, with a much larger population than Richmond, has remarkably similar ratios as Richmond.

When is this ratio useful? Well neighborhoods where there are spot lots still lingering, creating a building opportunity in a mature area. It can also be useful when deciding whether or not to build or buy an existing home or in understanding likely appraisal values when building a home outside of a typical subdivision (rural areas, mixed-use areas, or mature infill areas.)

Tear downs, also known as “pop-a-top,” can really benefit from this ratio because of a lack of comparable sales.’ As populations continue to surge upward in urban areas, there is a scarcity of new housing. Some suburban builders have sought to massively upgrade existing homes closer to city centers to maximize the value of the land upon which they sit. Builders can combine the Lot to Improvement plus New Home Premium to arrive at the new value of a renovated home.

$X per $1000

When you hear someone saying $5 per thousand or $7 per thousand, they are generally computing a mortgage payment.

If you look at a 30-year mortgage, monthly P&I payments will land pretty closely to the interest rate times the number of thousands borrowed. It might be clearer seeing the numbers in action: a 30-year mortgage of $300,000 would be $300 x 5, or $1,500. That’s not that far from the actual figure, given that something close to today’s rates puts P&I on $300,000 at 5% at $1,443. If you want to add in for taxes and insurance, bump the interest rate by one point and recalculate. If a borrower secured a $300,000 loan at 5%, the P&I + T&I (remember to add one to the 5%) would fall somewhere around $1,800.

(Want a sense of current mortgage rates, you can find them here…)

These calculations can be most useful with less experienced home buyers in the earliest stages of buying a home. It’s not a perfect technique and won’t work in all cases. But it does work in many and can give the borrower a decent idea of what monthly tab will be to own a particular home. Be careful to adjust upwards for loans where mortgage insurance is involved or for loans with amortizations less than 30 years.

Cash Flow, Down Payment and Break-Even

The rules of any game are certainly debatable, but I can’t imaging I’d get much of an argument on this one:

If you can buy a property with no money down and break even, it’s probably a nice deal.
If you can buy that property with 10 percent down and break even, we would probably call that a market value deal.
If you’re putting up 20 percent or more and still only breaking even, you might want to rethink that purchase (unless there is another angle to the investment)

I see this all the time on property brochures: “Cash Flow Positive” and I find it personally offensive. Every income property is cash flow positive if you can make a big enough down payment. Come to the table with the entire purchase price in cash—wow, you are going to see some positive cash flow (and hopefully you noticed the sarcastic tone.) What buyers really need to know is how much cash it takes to make the property flow…for the reasons stated above.

You have to be aware of this metric when you’re investing in real estate. In almost every case, what you’re really seeking out is return on your equity, or cash. Every real estate investor should have his or her own investment criteria—and if you don’t, it’s about time you started putting them together—which will influence the preferred types of investment options (multifamily, single family, land, net leased investments, and so on). Bottom line is the value of the rents relative to the value of the property should make sense (this is also known as the CAP Rate or Capitalization Rate.)

So before you go signing any contracts to buy, understand exactly how much cash will be coming to you every month, and what kind of cash you have to put up to generate that flow.

Expense Ratio

The expense ratio is the cost of utilities, taxes, all your insurances, and repairs/maintenance that a property will incur relative to gross rents. It won’t come as any surprise that older properties generally have higher ratios than newer ones. Same goes for assets with more tenants.

A six-unit apartment building in the Fan renovated in 1984 might shoulder a 40+ percent expense ratio compared to gross rents. Across town on the South Side, a newly renovated 22-unit property with new windows might be closer to 25 – 30 percent.

This ratio is critical when you’re putting a seller’s financials under the microscope. If you come across a seller touting a 25 percent expense ratio on a 1920s-era multifamily building, be very, very suspicious. Alternatively, an owner of a garden-style apartment complex might overstate expenses by coding maintenance items incorrectly as capital expenditures. Good investors will see that, and possibly use it as leverage.

Other Metrics to Know

There are a few other metrics (or inputs) that good agents pay close attention to. While they can’t stand on their own to evaluate a property, they can, when combined with the rules above, help provide an ever more accurate picture of what’s at stake. I have seen sharp, savvy agents agents be dead right on a transaction analysis without ever putting pen to paper. How? They understand extremely well everything we’re talking about here.

All good agents, investors, and developers will be well acquainted with these inputs (and the 2016 answers):

Construction Cost per SF – Today, it will run about $70 – 80/SF to build a basic home and more in the lower $100’s/SF for a home with a decent level of finishes (this does NOT include land cost.) If your builder is spending north of $160/SF+ on materials and labor (NOT including land) then you had either be buying a neo-classical version of the Taj Mahal or you need to take a timeout and start asking some serious questions.

Current CAP (Capitalization) Rates – When looking at institutional-grade properties, most investors are looking at a Cap rate somewhere around 6 percent. Basic apartment properties trading anywhere between 6.5-8 percent. Lower grade apartments—history of collection problems, serious restoration issues—will certainly trade higher, anywhere between 9-13 percent.

Current Mortgage Rates—Despite all the mortgage shenanigans of the early oughts, mortgage rates are still historically amazing. Good credit risks can get 30-year money below 5 percent. Adjustable rate mortgages can be for north of 3 percent. (October 2015.) If you want to know more about how interest rates are priced, read this.

Residential Rental Rates per SF (quoted monthly) – Rental rates in the Fan and Museum District are anywhere from about $1.00-1.25 with Downtown properties receiving closer to $170-1.80 per foot in rents. The counties run closer to $1.00/SF mostly due to larger home sizes.  When an apartment owner has a new property and includes most or all of the utilities, this number may reach (or exceed) $2.00 per foot in smaller apartments.

Market Values per SF (sometimes referred to as $/SF or “price per foot”) – Suburban Richmond prices per foot for brand-new construction run from a high of about $185/SF (Nuckols Road corridor) to about $170/SF for new homes along Robious Road. If you’re willing to look at moderately older properties, say 1990s, thos will trade for between $110-140/SF depending on locale. And, of course, properties in the more historic areas, such as the Fan, the Museum District,and Near West End will trade between $180 and 240/SF.

Conclusion

The rules I’ve discussed certainly aren’t set in stone. The real estate market is constantly evolving. So the smart investor has to evolve too and keep an eye on everything. If you’re diligent, you will be in the ball park far more often than not. And if you’re evaluating a property whose numbers aren’t working, that doesn’t mean there isn’t value there. But you’ve got to do some more work.

Ultimately, these “rules” are guidelines. They will give you some immediate insight, but they’re not a substitute for in-depth analysis and hard work. Over time, they will likely become second nature, and you’ll save time and quite a bit of money.

  • « Go to Previous Page
  • Go to page 1
  • Interim pages omitted …
  • Go to page 4
  • Go to page 5
  • Go to page 6
  • Go to page 7
  • Go to page 8
  • Interim pages omitted …
  • Go to page 10
  • Go to Next Page »

Primary Sidebar

804.201.9683


How Do I Schedule a Showing or Find Out More?

I am Kendall C. Kendall, Client Care Coordinator for the team. I am a licensed Realtor and it is my job to answer questions and schedule showings for the properties shown on our sites. Here's our call policy.

kendall@richmondrelocation.net

Working With Buyers

I am Sarah Jarvis, Broker at One South and I work with our buyers. I bring 20+ years of experience to our Buyers Advocacy program and take great pride in helping our clients understand the RVA marketplace.

sarah@richmondrelocation.net

From the Blog

Investing in Rental Property … A Primer

"I want to invest in rental property." "I want to flip houses." "I am thinking about owning some apartments ... what the deal with those?" We hear this constantly.  And we love it because it means someone else is in the nascent stages of realizing what many have known for years - owning …

[Read More...] about Investing in Rental Property … A Primer

More Posts from this Category

  • Facebook
  • Instagram
  • LinkedIn
  • Twitter

The Ultimate Stats Page

Ultimate Stats Page

Latest Tweets

  • Just now

Footer 1

Test Text

804.201.9683


How Do I Schedule a Showing?

I am Kendall C. Kendall, Client Care Coordinator for the team. I am a licensed Realtor and it is my job to answer questions and schedule showings for the properties shown on our sites. Here's our call policy.
kendall@richmondrelocation.net

804.305.2344


How Do I Determine What I Can Afford?

We offer competitive mortgage solutions with a commitment to exceed your expectations. We’re local industry experts who are also your friends and neighbors. Whether you want to communicate online or in person, we’re just a call or click away.
www.cfmortgagecorp.com
C&F Logo

Equal Housing

The Sarah Jarvis Team agrees to provide equal professional service without regard to the race, color, religion, sex, handicap, familial status, national origin or sexual orientation of any prospective client, customer, or of the residents of any community. Any request from a home seller, landlord, or buyer to act in a discriminatory manner will not be fulfilled.

IDX Disclaimer

All of the information displayed here is deemed to be gathered from reliable sources but no warranties, either express of implied, are made part of this site. Additionally, the IDX Feed for listing information may contain descriptions of properties not represented by One South Realty, its agents or staff and any violations or misrepresentations are the sole responsibility of the listing brokerage of the subject property in violation.

Contact The Sarah Jarvis Team

804.201.9683

One South Square Logo

2314 West Main Street Richmond, VA 23220

sarah@richmondrelocation.net

Our Call Policy

Accessibility
Copyright

Lending

Southern Trust Mortgage Logo

Chris Lester
Senior Loan Administrator
NMLS# 353830
804-307-7033
Email Southern Trust Mortgage

Our Network of Sites: RichmondVaNewHomes.net, RichmondVaCondos.net, RichmondLuxuryNeighborhoods.com,
RichmondFanRealEstate.net, RichmondVaMLSSearch.net
Housekeeping: Sitemap, Listings Sitemap


Members of the Sarah Jarvis team are licensed in the Commonwealth of Virginia.


Loading Comments...