• Skip to primary navigation
  • Skip to main content
  • Skip to primary sidebar

Sarah Jarvis Team at One South Realty

at One South Realty

  • Search MLS
  • Stats
  • Deals!
  • About Us
    • The Team
    • Testimonial
    • 5 Things I Tell My Clients
  • Calling Policy
  • The Blog
  • Show Search
Hide Search

Blog

Quick and Dirty Real Estate Math

September 24, 2015 By Rick Jarvis

Time is money—no question that that is about as cliché as it gets. But it also happens to be true, especially in real estate. That’s why the ability to do a “quick and dirty” analysis of a transaction is absolutely critical. If you abide by some basic “rules of the game,” you can quickly identify the bad deals from the good and reduce your exposure to mistakes.

null_png

Here are some of those rules of the game that experienced Realtors use every day:

The New Home Premium

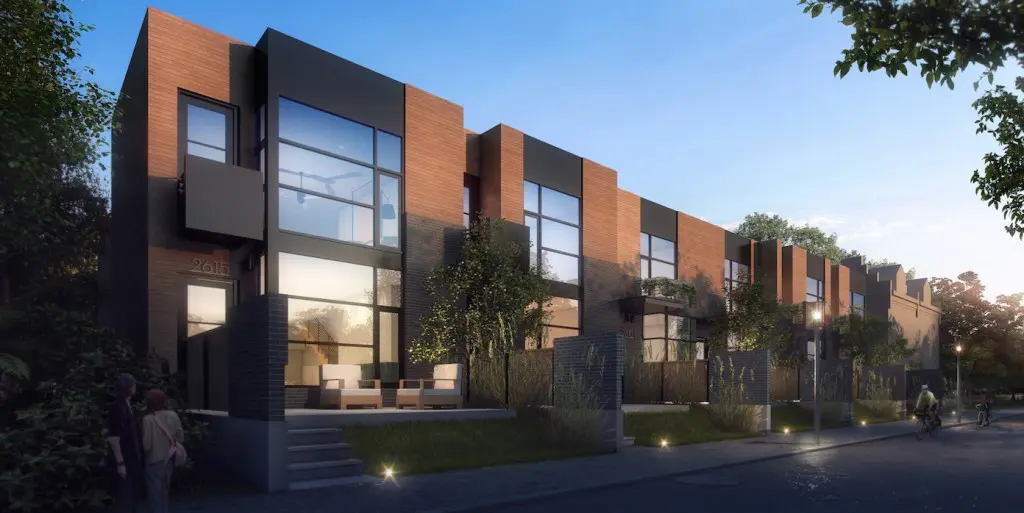
This one is a must for builders—whether they’re pricing homes for sale or gauging whether to purchase buildable lots. Certainly construction costs are a fundamental input to pricing, but a good builder always has an acute sense of a given market’s desire for new housing over existing housing. Put another way: how much will a buyer pay own a new home versus an existing one? If a relatively similar brand-new home and a 10-year-old home are both priced at $400,000, a buyer will almost always choose the new one. But can the builder charge more for the new home—and how much? $20,000 more? $40,000?? $60,000??? This is what we had to figure out when we were pricing the Citizen 6 Project on Floyd Avenue and the Tribeca Brownstones in Randolph.

Homes in the Citizen 6 infill project were both tricky to price and tricky for the appraisers.

But understanding how tocalculate this premium isn’t useful just for builders. A buyer is better equipped if he or she understands this calculation as well. Depending on the age of the home, the location, and the number of new homes available, a new home premium can fall anywhere between 7-20 percent (read more about thing you should know when building a home.) In neighborhoods that are somewhat starved of new homes, the premium can go even higher. On the other hand, if an existing home is still pretty new—say, fewer than three years old—the premium will shrink. This can help in areas that might have lots of new housing nearby.

The ‘Lot to Improvement’ Ratio

The ratio of “lot to improvement” is really the percentage of the total value of the property that belongs to the land. Stated another way, how much of the TOTAL value of a property is in the land and how much is in the house? In the Richmond metro area, land value usually hovers between 20-30 percent of a property’s total market value…meaning that a home whose price is $500,000 is built on a lot whose value is roughly $100,000 to $150,000. Naturally, this is not a fixed ratio. A home’s age and neighborhood quality will affect this ratio. But when you’re talking about a consistent type of housing in a relatively young neighborhood, perhaps around 20 years old, this measurement is pretty reliable.

A distribution showing the age of homes across the region. Kinda cool, no?
A heat mapped distribution of the age of homes across the region. Kinda cool, no?

Before you make this a true rule of thumb, understand that it’s a hyper-local calculation. Different regions can have radically different ratios for any number of reasons. Look at the Washington, DC, metro area: land value approaches 50 percent in many neighborhoods. In the Outer Banks, especially along the ocean, you’ll see ratios climb even higher. Interestingly, Charlotte, with a much larger population than Richmond, has remarkably similar ratios as Richmond.

When is this ratio useful? Well neighborhoods where there are spot lots still lingering, creating a building opportunity in a mature area. It can also be useful when deciding whether or not to build or buy an existing home or in understanding likely appraisal values when building a home outside of a typical subdivision (rural areas, mixed-use areas, or mature infill areas.)

Tear downs, also known as “pop-a-top,” can really benefit from this ratio because of a lack of comparable sales.’ As populations continue to surge upward in urban areas, there is a scarcity of new housing. Some suburban builders have sought to massively upgrade existing homes closer to city centers to maximize the value of the land upon which they sit. Builders can combine the Lot to Improvement plus New Home Premium to arrive at the new value of a renovated home.

$X per $1000

When you hear someone saying $5 per thousand or $7 per thousand, they are generally computing a mortgage payment.

If you look at a 30-year mortgage, monthly P&I payments will land pretty closely to the interest rate times the number of thousands borrowed. It might be clearer seeing the numbers in action: a 30-year mortgage of $300,000 would be $300 x 5, or $1,500. That’s not that far from the actual figure, given that something close to today’s rates puts P&I on $300,000 at 5% at $1,443. If you want to add in for taxes and insurance, bump the interest rate by one point and recalculate. If a borrower secured a $300,000 loan at 5%, the P&I + T&I (remember to add one to the 5%) would fall somewhere around $1,800.

(Want a sense of current mortgage rates, you can find them here…)

These calculations can be most useful with less experienced home buyers in the earliest stages of buying a home. It’s not a perfect technique and won’t work in all cases. But it does work in many and can give the borrower a decent idea of what monthly tab will be to own a particular home. Be careful to adjust upwards for loans where mortgage insurance is involved or for loans with amortizations less than 30 years.

Cash Flow, Down Payment and Break-Even

The rules of any game are certainly debatable, but I can’t imaging I’d get much of an argument on this one:

If you can buy a property with no money down and break even, it’s probably a nice deal.
If you can buy that property with 10 percent down and break even, we would probably call that a market value deal.
If you’re putting up 20 percent or more and still only breaking even, you might want to rethink that purchase (unless there is another angle to the investment)

I see this all the time on property brochures: “Cash Flow Positive” and I find it personally offensive. Every income property is cash flow positive if you can make a big enough down payment. Come to the table with the entire purchase price in cash—wow, you are going to see some positive cash flow (and hopefully you noticed the sarcastic tone.) What buyers really need to know is how much cash it takes to make the property flow…for the reasons stated above.

You have to be aware of this metric when you’re investing in real estate. In almost every case, what you’re really seeking out is return on your equity, or cash. Every real estate investor should have his or her own investment criteria—and if you don’t, it’s about time you started putting them together—which will influence the preferred types of investment options (multifamily, single family, land, net leased investments, and so on). Bottom line is the value of the rents relative to the value of the property should make sense (this is also known as the CAP Rate or Capitalization Rate.)

So before you go signing any contracts to buy, understand exactly how much cash will be coming to you every month, and what kind of cash you have to put up to generate that flow.

Expense Ratio

The expense ratio is the cost of utilities, taxes, all your insurances, and repairs/maintenance that a property will incur relative to gross rents. It won’t come as any surprise that older properties generally have higher ratios than newer ones. Same goes for assets with more tenants.

A six-unit apartment building in the Fan renovated in 1984 might shoulder a 40+ percent expense ratio compared to gross rents. Across town on the South Side, a newly renovated 22-unit property with new windows might be closer to 25 – 30 percent.

This ratio is critical when you’re putting a seller’s financials under the microscope. If you come across a seller touting a 25 percent expense ratio on a 1920s-era multifamily building, be very, very suspicious. Alternatively, an owner of a garden-style apartment complex might overstate expenses by coding maintenance items incorrectly as capital expenditures. Good investors will see that, and possibly use it as leverage.

Other Metrics to Know

There are a few other metrics (or inputs) that good agents pay close attention to. While they can’t stand on their own to evaluate a property, they can, when combined with the rules above, help provide an ever more accurate picture of what’s at stake. I have seen sharp, savvy agents agents be dead right on a transaction analysis without ever putting pen to paper. How? They understand extremely well everything we’re talking about here.

All good agents, investors, and developers will be well acquainted with these inputs (and the 2016 answers):

Construction Cost per SF – Today, it will run about $70 – 80/SF to build a basic home and more in the lower $100’s/SF for a home with a decent level of finishes (this does NOT include land cost.) If your builder is spending north of $160/SF+ on materials and labor (NOT including land) then you had either be buying a neo-classical version of the Taj Mahal or you need to take a timeout and start asking some serious questions.

Current CAP (Capitalization) Rates – When looking at institutional-grade properties, most investors are looking at a Cap rate somewhere around 6 percent. Basic apartment properties trading anywhere between 6.5-8 percent. Lower grade apartments—history of collection problems, serious restoration issues—will certainly trade higher, anywhere between 9-13 percent.

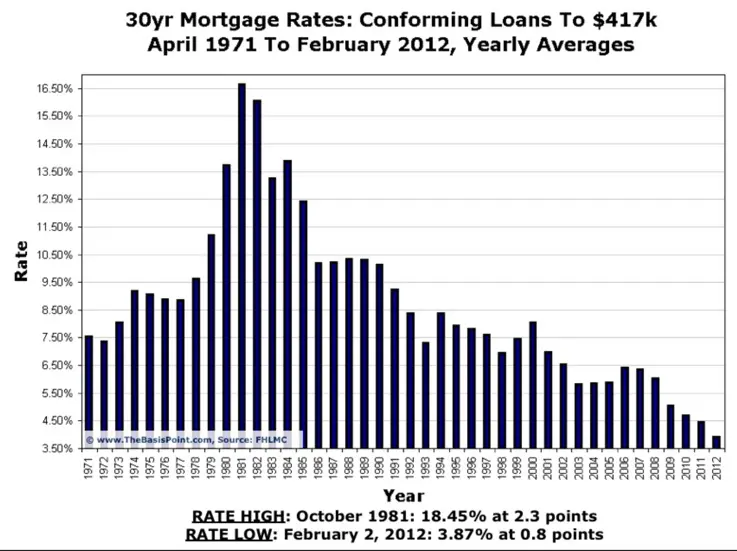
Current Mortgage Rates—Despite all the mortgage shenanigans of the early oughts, mortgage rates are still historically amazing. Good credit risks can get 30-year money below 5 percent. Adjustable rate mortgages can be for north of 3 percent. (October 2015.) If you want to know more about how interest rates are priced, read this.

Residential Rental Rates per SF (quoted monthly) – Rental rates in the Fan and Museum District are anywhere from about $1.00-1.25 with Downtown properties receiving closer to $170-1.80 per foot in rents. The counties run closer to $1.00/SF mostly due to larger home sizes.  When an apartment owner has a new property and includes most or all of the utilities, this number may reach (or exceed) $2.00 per foot in smaller apartments.

Market Values per SF (sometimes referred to as $/SF or “price per foot”) – Suburban Richmond prices per foot for brand-new construction run from a high of about $185/SF (Nuckols Road corridor) to about $170/SF for new homes along Robious Road. If you’re willing to look at moderately older properties, say 1990s, thos will trade for between $110-140/SF depending on locale. And, of course, properties in the more historic areas, such as the Fan, the Museum District,and Near West End will trade between $180 and 240/SF.

Conclusion

The rules I’ve discussed certainly aren’t set in stone. The real estate market is constantly evolving. So the smart investor has to evolve too and keep an eye on everything. If you’re diligent, you will be in the ball park far more often than not. And if you’re evaluating a property whose numbers aren’t working, that doesn’t mean there isn’t value there. But you’ve got to do some more work.

Ultimately, these “rules” are guidelines. They will give you some immediate insight, but they’re not a substitute for in-depth analysis and hard work. Over time, they will likely become second nature, and you’ll save time and quite a bit of money.

A Chef, A Greenskeeper and a Realtor Walk into a Bar …

September 14, 2015 By Rick Jarvis

‘Why do we need a Realtor?’

In my early years, I used to get offended by that question. Probably the main reason was that I didn’t really have a good answer. Uhhh … contract … MLS …. Lockbox … you need us!


But as I have aged in this industry, I actually have come to enjoy being asked the question. Why? Because it gives me a chance to educate the clients as to our role and the value we add.

I can cook, but I am no chef…

Sometime in the late 1990’s, as a thank you gift from a client, a personal chef came to our house and cooked a meal for us. It was the first time I met Ellie Basch.

The fig an Prosciutto salad rocks. And her seared tuna is always worth the price of admission.
Ellie’s fig and Prosciutto salad rocks. And her seared tuna is always worth the price of admission.

Now, for those who have ever been on the receiving end of a Jarvis-prepared feast, we are pretty good cooks. I am not saying we are ready to compete on any cooking shows, but you will not feel cheated if you get to eat at Chez Jarvis. My wife’s tenderloin is restaurant quality and I am pretty adept anything grill related. So, as competitive as I am, I could not wait to see if the personal chef (Ellie) was that much better than we were.

Long story short, she was.

Ellie not only made us an absolutely awesome meal (and it was so awesome that we still use her for the One South holiday party some 10+ years later,) it was how she went about making it that was equally impressive. She made it in a stranger’s kitchen, wasted no food, created about 1/10 of the mess we would have and brought it all together at not only the exact same instant, but at the perfect temperature. Lastly, she did what would have taken us several hours and did it 30 minutes, tops.

In all honesty, it was not only fun to watch, it was a great life lesson about being an amateur and being a pro.

You can putt on my lawn, but it won’t be any fun…

I have another good friend who is the superintendent at an upscale golf course. Now, as he will readily admit, growing grass is perhaps the simplest form of agriculture imaginable. Everyone, at some level, can grow grass – seed + water + dirt + waiting – it is not that hard.

Golf, anyone?
Golf, anyone?

But just know this – golf courses, when at their best, are being pushed to their limits of health in order to create conditions most desirable to the golfing community. In key parts of the season, particularly the summer months, it his job to take the grass to the edge without killing it.

So imagine managing 200 acres to its limits each and every day, with multiple types of grasses growing in varied soils, varied shade conditions, highly varied air circulation conditions and varied moisture conditions all while trying to anticipate Virginia’s schizophrenic climate. If the National Weather Service gets it wrong by 5 degrees, especially during the peak summertime, you can kill an entire golf course.

Talk about pressure …

The short version is that my friend is equal parts scientist and artist.  He takes what are an infinite number of variables (nature) and makes sense of them all. He not only has to answer to himself, he answers to those who only see the results but rarely understand the constraints. His work is so good it is considered elite not just here locally, but at a national level.

And you know what else? He makes it look easy.

But real estate is easy …

For anyone who has even been through a real estate transaction, it can appear easy, especially if the agent you are working with is an accomplished pro.  Realize that the biggest part of the reason the transaction is easy is the advice they are providing and the work they are doing that you never see.

Doctors, mechanics, accountants, stylists, PR people, architects, graphic artists … and yes, chefs, golf superintendents and Realtors … we all do things that the public rarely sees and consequently doesn’t fully appreciate.  Yet thanks to HGTV, Zillow, Trulia, Houzz and Pinterest, the myth that real estate is a D-I-Y endeavor is perpetuated.

It is unfortunate because it is just not that easy.

So you can be your own Realtor, but should you?

It didn’t take Ellie 30 minutes to make my meal, it took her 10 years and 30 minutes to make my meal.

It didn’t take my golf buddy a few hours to lay out the protocol for maintaining green speeds on 97 degree days, it took him 15 years and few hours to lay out that protocol.

And guess what else, despite how it sometimes seems, it didn’t take me (or any other Realtor) a few hours to sell your home or find you the perfect home – it took us far longer.

The information and knowledge that we convey to our clients each and every day may seem like we just went to MLS and pushed the ‘meaningful statistic’ button … we didn’t.  Odds are the analysis we did was pulled from the latest market data and created exclusively for you.

While getting a real estate license is relatively easy, becoming a true pro is not. A good pro agent has a feel for values, trends, appraisals, incentives, geography, contract structure, marketing, data, analysis, competition, human nature, staging, design, construction, schools, zoning, finance, rental rates, law and negotiations (and yes, this is an abbreviated list.) We also have to keep up with changes in technology, continuing education, both local and national development and what goes on in Washington, DC.  It is not easy.

When a good agent makes a recommendation, it is based on far more than you can find on one of the thousands of websites dedicate to D-I-Y real estate.

Hire a pro. You will be happy.

Don’t Bring Your Macro to a Micro Fight

September 13, 2015 By Rick Jarvis

microMicro or macro?
Factual or anecdotal?
Data point to trend?
Forest or trees?
Big picture or small picture?

There is an old adage that goes something like this – ‘Don’t bring a knife to a gun fight.’ Personally, I have always tried to avoid fights (especially ones where weapons are involved) so I find that statement particularly easy to abide by. But as it relates to real estate, I often see buyers and sellers using large statistical based arguments to guide individual decisions … or I see them using anecdotal points to try override what large sets of numbers are trying to tell them.

It is unfortunate.

Data Points or Trends?

As agents, we constantly hear – “Well the house down the street sold for $450,000 … ”

I’m sure it did … but how long did it take? Did several sell at that price or just that one? Did they drop the price multiple times or did they get multiple offers? What were the terms? Was there personal property included? Or did the seller include closing costs What was the condition? What season? How many houses were on the market when it did? Who was the builder?

We also hear – “Well the average dollar per square foot in the neighborhood is $165 …”

I’m sure it is … but what houses were included in the analysis? Was the age range set tightly or loosely? How many had a finished 3rd floor … or basement? Or an oversized lot? Or were recently renovated? Same builder? Is the data from the fall or spring? What were the highs and lows?

As you can see, many questions need to be answered in both cases to validate either statistic. Despite the need to fully understand the statistic, many times buyers or sellers (or agents!) grab the one data point out of a sea of analysis that supports their version of the narrative and subsequently base their entire strategy upon it. It rarely works out well.

Micro and Macro Are Different

In its simplest form, MICROeconomics is the study of an individual’s (or entity’s) behavior when resources are limited. This is contrasted with MACROeconomics, where an entire economy is being studied (yes, Econ majors, I know that is a gross oversimplification of Macro and Micro theory, sorry.)

When an individual elects to buy or sell because they feel that the economy is doing well and prices are likely to rise, they are making their decision based on more of a MACRO-economic analysis. If a couple changes their behavior because 3 homes in their neighborhood just sold at record prices, then they are making more of a MICRO-economic decision.

In either case, both micro and macro based decision making is fine, when used to make micro or macro decisions, respectively. However, using macro stats for micro decisions (or vice versa) is not as sound of a practice.

One of the most common mistakes we see is clients taking overall market statistics (MACRO) and trying to apply them to a specific neighborhood (MICRO). Take a look at the chart below – the following graph shows the inventory levels in different segments of the market:

  • Overall Richmond Metro inventory levels (blue line)
  • Southern Chesterfield inventory (purple line)
  • Museum District/Windsor Farms (red line)

As you can tell, the inventory levels in Southern Chesterfield are far higher than both the overall Richmond market and the close-in areas surrounding Carytown.  The MACRO inventory (Richmond Metro) tells a far different story about the market than the MICRO inventory counts in 23838 and 23221.  A client moving from 23832 to 23221 but using a strategy based on 23832 data will not find success.  Similarly, pricing or negotiation strategies based on the entire Richmond region would have drastically different results in either 23838 or 23221. Make sense?

Be wary of bringing your macro analysis to a micro analysis decision (and vice versa …)

Summary

We are all constantly searching for data points to fit our preferred narrative. Sometimes we look down the street at a single comparative sale (out of seven) or sometimes we look to MSNBC, CNNMoney or the Case-Shiller Index for aggregate demand data … both can be equally right (or wrong) depending on the type of decision you are tying to make.

In order to really make the best decisions, know your data. Apply data correctly and you will find your outcomes far better.

Interest Rates 101

August 31, 2015 By Rick Jarvis

When I got my license in 1993, interest rates were 7.5%.
By the end of 1994, interest rates were approaching 9.5%.
When the market really got rolling in the early 2000’s, interest rates were still hovering around 8%.

In 2008 (the year the market crash began in earnest,) mortgage interest rates crept up near 7% during the summer before falling quickly.
In 2009, rates fell below 5%.
In 2011, rates fell below 4%.

The market has stayed + 4% range for most of the last several years and despite numerous predictions that rates will begin to rise, they really haven’t.

mortggae_rate_chart_-_Google_Search

Sounds insane, doesn’t it?

When every market crashed in 2008, the Federal Reserve took the unprecedented action of flooding the market with cheap money.  They reasoned (and they were largely correct) that the banks would stop loaning their own money in a market where assets were losing value rapidly and they needed to make cheap money available to prop everyone (and everything) up for while.  The Fed did everything they could to flood the market with liquidity by dropping their rate to 0% and FORCING money into the system via the Quantitative Easing programs.

As market watchers, we get a lot of questions about interest rates.  Will rates go up?  Down?  Flat?  Should I lock in?  Should I get a fixed rate?  Adjustable?  Hybrid?  What to do??

And now, with the following disclaimer – this post is filled with many oversimplifications – here begins the post about interest rate fundamentals.

What is an Interest Rate?

An interest rate is nothing more than a rate of return extracted from the lender when they loan money to a borrower.  In theory, the lender should receive compensation (interest) that is consistent with the amount of risk the loan carries.

Lending money to a doctor to buy a home is (in theory) far less risky than loaning it to your unemployed cousin who wants to start a llama farm … and thus the interest rate you charge should reflect the difference.

In its simplest form, an interest rate is made up of three primary pricing components:

  • The ‘Pure Rate’
  • Repayment Risk
  • Inflation Risk

Each is discussed below.

The Pure Rate

What if, as a lender, you knew that there was absolutely no chance than you would not get paid back and that when you did, the money you get back would be worth the same … what rate would you charge?  That is the definition of the ‘Pure Rate’ of interest.

I have seen studies discussing this concept and generally speaking, they isolate the Pure Rate at somewhere between 2 and 3%.  In a very simplistic way, you can imagine the Pure Rate of 2% as the floor for all interest rates.  Any interest rate above 2% is due to risk factors over and above the Pure Rate.

Repayment Risk

Cute little dudes, eh?

So, using the cousin and the llamas example from above, assume you loaned him $50k to buy some land and some llamas.  What do you think the likelihood is of getting your loan back from him?  My guess is ‘less than 100%’  So in order to compensate you for the substantial risk, you should charge your cousin a high rate of interest for the loan to buy the land and/or llamas.

Generally speaking, banks like to loan against owner-occupied single family housing.  Why?  Because it is a relatively low risk to do so.

Banks (more or less) figure that when push comes to shove, you will make the house payment before you make your rental property payment or your boat payment.  Additionally, if you don’t make the payment on your home, they can take it from you, sell it, and get their money back.  Traditionally, lending against housing is a pretty safe bet for banks (2008 – 2011 aside.)

(Now, for this post, we are ignoring the impact of many underwriting factors on the repayment risk.  Suffice it to say, down payment, loan limits, asset types, the GSE’s (Fannie Mae, Freddie Mac, Ginnie Mae) all can impact rates as they all influence risk to some extent.  But generally speaking, the difference between a Maximum FHA loan with Mortgage Insurance and a Conventional Fannie Mae 80% is less than 1% in APR.)

So just know that the bank making you a loan secured by the home you are buying is historically a pretty safe bet for them, despite what recent memory tells us to be true.

Inflation Risk

We have all head the stories from our parents and grandparents … ‘I remember when gas was a quarter and a soda was a nickel.’

To illustrate, if you took out a mortgage in 1985 (30 years ago) and made your last payment today, you would have paid the bank back with money that used to be worth far more:

  • gas was $1.09/gallon in 1985
  • the average new home cost $89k in 1985
  • the average new car was $9k in 1985

Pretty amazing, huh?

So it is safe to say that the value of money has changed over time – and the difference between what money is worth over time is called ‘inflation’ (or deflation, if prices go down.)  Imagine loaning someone money for 30 years and then getting it back … what would it buy?  Far less, that is for sure, so you better charge for it.

So when a bank commits to lending you money for 30 years, they need to make sure that when they are paid back, the money they receive back has the same value as it did when they lent it to you.  Know that the rate they they charge you is reflective of what they feel their money will be worth when they get it back.

Pricing Mortgage Interest Rates

So how are mortgage rates priced?  Think of it as adding the three components together:

  • The Pure Rate + Repayment Risk + Inflation Risk = Interest Rate

Well if the ‘Pure Rate’ is largely fixed and the Repayment Risk is pretty small, then the difference must be inflation, right?

Yep.

When you see loans in the 3 – 4% range, what is really being said is that the expectation for prices for the core goods and services in our economy to rise substantially in the immediate future is relatively small.  And given the recent upheaval in the Chinese stock market, the likelihood of the world economy getting overheated again (at least for the foreseeable future) is pretty small and thus, rates should remain relatively low for quite some time.

The Fed vs. ‘The Market’

One of the most commonly misunderstood parts of interest rate pricing surrounds who is actually doing the pricing of the rates.  Many people incorrectly assume that the Federal Reserve sets the rates – which is not true – mortgage interest rates are set by a mysterious force we call ‘the market.’

So what is ‘the market’ you ask?  Currency exchanges, the bond market, Wall Street, The Federal Reserve, both large and small banks, puts, calls, options, derivatives … all are in some part an input to the overall market and have an impact on the price of money.  These entities constantly look into the future and either buy or sell the right to money at specific prices based on their version of where they think the value of money is headed.

When money is in demand and supply is fixed, interest rates will tend to rise.  Conversely, when the demand is low and the supply is higher, then the prices will tend to drop (think 2012.)  The Federal Reserve has the ability to increase or decrease the supply of money to INFLUENCE the rates, but they do not set them.  When you see the 6 o’clock news talk about the Federal Reserve announcing QE II or the leaving the Federal Funds Rate alone, they are simply using the tools they have available to hopefully increase (or decrease) the supply of money (and its price) in hopes of properly supplying the needs of the capital markets.  It is an amazing dance to watch.

But to emphasize – the Federal Reserve cannot dictate the price of money, only influence it.  Imagine trying to drive a car at a constant speed without using the brakes and you will know what it like to be The Fed.  You can speed up by giving the car more gas and you TRY to slow down by downshifting or taking your foot off of the gas, but ultimately, things like gravity and wind and road conditions (or crashing into a tree) are what will make your car come to rest.  But thinking the Federal Reserve sets your rates is technically incorrect despite many’s belief.

Long Term vs Short Term Rates

Continuing the theme from above – no interest rate discussion would be complete without pointing out how long term and shorter term rates are priced.

Basically, as a borrower, you have two mortgage product options – fixed rate products or adjustable rate products.  As one one would expect, a fixed rate mortgage has a rate that stays constant over the life of the loan while an adjustable rate loan contains language that allows the rate to adjust at specific intervals based on a specific index.  What is really happening is the risk of inflation is being redistributed depending on who has the right to the rate and for how long.

In an adjustable rate mortgage, the borrower carries the inflation risk by agreeing to allow their rate to periodically adjust to market conditions. In a fixed rate mortgage, the lender carries the inflation risk as they CANNOT change the rate, even if inflation increases.  It is why you typically see adjustable rates trade lower than fixed ones.

An interesting note is that in recent history, the difference between the adjustable rates and fixed rates (sometimes referred to as the ‘spread’) has been extremely small.  Why?  If you guessed ‘low expectation for inflation’ then you are beginning to get the hang of this!

Summary

If and when we being to see rates rise, it will be for one of the following reasons:

  • ‘The Market’ is seeing the global economy is heating up
  • The Federal Reserve decides to decrease the money supply
  • The Federal Reserve decides to increase the rate at which they charge banks to borrow money

And specifically, if you see the long term rates rise, it is because the market is beginning to expect inflation and if you see short term rates rise, it is due to the Fed trying to influence the market.

The interest rate markets and pricing models are extremely complex and those who successfully buy, sell and loan money for a living are very astute.  That said, even if you are not a professional, having the ability to understand the correct way to finance properties can save hundreds of thousands of dollars over your lifetime.  Spend some time understanding interest rates … you will be handsomely rewarded for it.

Making Sense of the Numbers

August 17, 2015 By Rick Jarvis

We got one of these a week for my first several years in the business. As thick as a phone book .... amazing.
We got one of these a week for my first several years in the business. As thick as a phone book …. amazing.

It used to be simple(er).

When I first became licensed (1993), things were far different than they are today.  Back then, if you wanted to know what homes were available for sale, you used to have to wait for the Richmond Association of Realtors to deliver the ‘MLS Book.’ Each Friday, our local Multiple Listing Service would deliver us a stack of MLS books, approximately the size of phone books (I am not making this up) every Friday afternoon to each and every office in the Metro. As an agent, you would thumb through the pages and make copies and fax them to people or (GASP!) hop on the landline phone and call clients to tell them about the latest and greatest property for sale.

No text. No e mail. No cloud. No Authentisign. No DropBox. Just a phone book in black and white with a picture of the front of the house. That is all you got to go on. Good luck.

You know what?  We got it done.

Access.  Access.  Access.

Fast forward to today and I now have access to MLS via desktop, laptop, smartphone or tablet. I also have online access to the City and County tax records for assessments, past sales or other searches. From MLS, I can download bunches of records and export them to a spreadsheet to help with analysis, or I can also use one of the numerous functions inside of MLS to see trends and find neighborhood highs and lows.  If I am too lazy to analyze my own info, I can have it spoon fed to me by a myriad of statistical services that can slice, dice, merge and layer sales and demographic data into neat little charts and graphs.

Outside of MLS, I can look at Zillow’s estimates of value (as well as about 20 other automated value estimates) and gobs of research from Case Shiller or the NAR. And all of this info is available to me BEFORE I ever type anything into the Google bar and see what I can find out there floating in the web, on blogs or in research papers.

On one hand, it makes wonder how we ever did our job before all of this information was available. And on the other hand, it makes me wonder what is coming next … but that is another post for another day.

Easy as 1, 2, 3 … 4, 5, 6, 9, 37, 142, 359 … Wait, this is Hard!

The relative ease at which we can all access information is, in my opinion, the signature development in the last decade.  So it would stand to reason that with all of this access, being an agent, buyer or seller should be easier than ever … but is it?

I don’t think so.

Simply put, with access to an almost unlimited amount of information, it is getting incredibly difficult to tell what data is meaningful, what data matters and most importantly, what it all means.

Look at the chart above … does it really tell you anything?

As a buyer, should I care that the 2nd Quarter’s sales of 1,800 – 2,000 SF homes in 23832 is 11.1% above the same quarter last year? Or down 35.2% from the previous quarter? What do I do with these facts?  Should it change my strategy?  Does it make my offer lower??  Should I rent???  Should I pay cash???? Should I move to Canada?????  Or should I just paint my house mauve and fuchsia and stay put …

What Do I Do Differently?

As an agent, it now takes me about 3 times as long to explain my role than it did in 1993 … that’s all that has really changed. I still do the same basic things, it just takes me far longer to explain it than it used to and thus I have about 20 new speeches to help people make sense of the process.

Here are a sample of my new speeches –

  • ‘Why isn’t this house for sale in MLS when I see it on Trulia?’  (Answer –  Trulia is not MLS)
  • ‘Why is the house for sale on Trulia but not in MLS?’ (Answer, Again, Trulia is not MLS)
  • ‘Why is some other agent’s picture next to my home on Yahoo Real Estate when it is your listing?’ (Answer – because Yahoo isn’t MLS, either)
  • ‘Why can I get a 3.9% mortgage from USAA when the lender you recommended is at 4.25%?’ (Answer – because closing dates don’t mean anything to them)
  • ‘Why does Zillow say my house is worth $375,000 when I just paid $400,000 last year?’ speech (Answer – Because it is a computer generated estimate)
  • ‘What do you mean we aren’t closing Friday?!?’ (Answer – Because Dodd-Frank/TRID just mandated a 3 day wait period for changes to closing statements)

And many more.

My Job is Still the Same

The bottom line is that all of the changes in the past decade haven’t really changed what I do, it has only changed how many things I have to cover with my clients before they understand the process.

And guess what – the public is more confused than ever before.

A recent study showed that the number of people using agents has actually increased in the past 5 years. So despite the relative ubiquity of information with blogs and message boards explaining the home buying (or selling) process in great detail, the public is entrusting their real estate transactions to Realtors at increasing levels.  I find this trend both fascinating and refreshing.

At the end of the day, having information and knowing what it means are two different things.  A good agent knows the difference and can help you make sense of an increasingly complex and complicated process.

Its our job to make sense of it all. Use us.


  • « Go to Previous Page
  • Go to page 1
  • Interim pages omitted …
  • Go to page 16
  • Go to page 17
  • Go to page 18
  • Go to page 19
  • Go to page 20
  • Interim pages omitted …
  • Go to page 31
  • Go to Next Page »

Primary Sidebar

804.201.9683


How Do I Schedule a Showing or Find Out More?

I am Kendall C. Kendall, Client Care Coordinator for the team. I am a licensed Realtor and it is my job to answer questions and schedule showings for the properties shown on our sites. Here's our call policy.

kendall@richmondrelocation.net

Working With Buyers

I am Sarah Jarvis, Broker at One South and I work with our buyers. I bring 20+ years of experience to our Buyers Advocacy program and take great pride in helping our clients understand the RVA marketplace.

sarah@richmondrelocation.net

From the Blog

The Making of an American Farmhouse — Walnut Hill, Rockville VA

Periodically, you get smitten with a neighborhood, and Walnut Hill in the Rockville area of Western Hanover County tends to have that effect on people. Walnut Hill is pretty close to what most are envisioning when they imagine a classic neighborhood in a rural setting. With extremely large lot …

[Read More...] about The Making of an American Farmhouse — Walnut Hill, Rockville VA

More Posts from this Category

  • Facebook
  • Instagram
  • LinkedIn
  • Twitter

The Ultimate Stats Page

Ultimate Stats Page

Latest Tweets

  • Just now

Footer 1

Test Text

804.201.9683


How Do I Schedule a Showing?

I am Kendall C. Kendall, Client Care Coordinator for the team. I am a licensed Realtor and it is my job to answer questions and schedule showings for the properties shown on our sites. Here's our call policy.
kendall@richmondrelocation.net

804.305.2344


How Do I Determine What I Can Afford?

We offer competitive mortgage solutions with a commitment to exceed your expectations. We’re local industry experts who are also your friends and neighbors. Whether you want to communicate online or in person, we’re just a call or click away.
www.cfmortgagecorp.com
C&F Logo

Equal Housing

The Sarah Jarvis Team agrees to provide equal professional service without regard to the race, color, religion, sex, handicap, familial status, national origin or sexual orientation of any prospective client, customer, or of the residents of any community. Any request from a home seller, landlord, or buyer to act in a discriminatory manner will not be fulfilled.

IDX Disclaimer

All of the information displayed here is deemed to be gathered from reliable sources but no warranties, either express of implied, are made part of this site. Additionally, the IDX Feed for listing information may contain descriptions of properties not represented by One South Realty, its agents or staff and any violations or misrepresentations are the sole responsibility of the listing brokerage of the subject property in violation.

Contact The Sarah Jarvis Team

804.201.9683

One South Square Logo

2314 West Main Street Richmond, VA 23220

sarah@richmondrelocation.net

Our Call Policy

Accessibility
Copyright

Lending

Southern Trust Mortgage Logo

Chris Lester
Senior Loan Administrator
NMLS# 353830
804-307-7033
Email Southern Trust Mortgage

Our Network of Sites: RichmondVaNewHomes.net, RichmondVaCondos.net, RichmondLuxuryNeighborhoods.com,
RichmondFanRealEstate.net, RichmondVaMLSSearch.net
Housekeeping: Sitemap, Listings Sitemap


Members of the Sarah Jarvis team are licensed in the Commonwealth of Virginia.


Loading Comments...