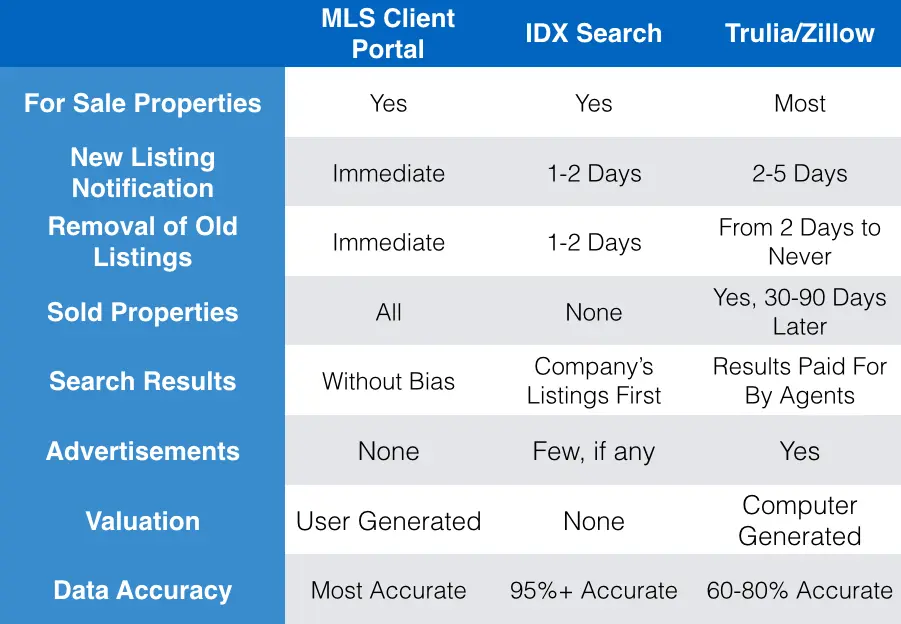
We love our Multiple Listing Service (MLS.)
In terms of importance, think of it this way – it is a curated database that has recorded in great detail upwards of 95% of the real estate transactions that have occurred in our marketplace dating back decades. The accuracy of the database is protected by spot checks, self-policing and stiff penalties for incorrect use (both accidental and intentional.) I challenge anyone to find a more accurate database that is as all-enomcpassing as the local MLS.

Why MLS Matters
When you realize that the local MLS database helps guide millions of people in the acquisition and sale of what is typically one of the biggest, if not THE biggest assets in their portfolio, you begin to understand its importance.
[ Want a direct link to MLS? Click here to learn how ]
People tend to think of MLS in terms of letting Realtors know what is on the market and what has recently sold … which MLS does and does quite well. But most don’t often consider what else it can tell us and how to use that knowledge to guide us. The idea of ‘Big Data’ is entering its golden age as the software required to do first rate analysis of the data is becoming simultaneously cheaper and more powerful. It will not be long before SAS or IBM brings the capability to analyze large swaths of data to the layperson level and I, personally, can’t wait.
But until we can buy access to the software cheaply enough AND MLS allows unfettered access to the records (they currently have strict limits on downloads), the best we can do is use the existing tools in MLS to analyze smaller data sets to try to find answers to some really neat questions.
Below are some statistics that are easily computable in MLS, yet rarely used.
List Price to Sale Price Ratio (LP/SP)
The price a seller is asking for a home and the price it sells for is generally not equal. In most markets, the seller and buyer negotiate a price that is below the asking price by some number. In some instances (most commonly in the spring and in a highly sought-after market,) the price may get bid up above the original asking price if multiple offers are received.
Now the statistic itself, for most markets, tends to stay somewhere in the 94-98% range. In the darkest days of 2009-11, we did see some instances of sub 90% LP/SP, but that is rare. A general rule of thumb is that 3% below ask is a good number to model.
Now, many choose to use the LP/SP ratio when coming up with an offer OR when estimating their proceeds from a sale. Both of these uses are legitimate and informative.
That said, the statistic delivers another very powerful message that is not oft-discussed. Assuming for a minute that a buyer will generally negotiate up by roughly the same amount a seller will negotiate down, most offers will come in anywhere from 92 – 95% of the actual asking price. This implies the asking price for a home must be within 8% of the actual value of the home in order to receive an offer. Otherwise, the buyer is likely to focus on other homes for sale.
It is amazing the number of sellers who fail to realize that the practice of raising the price to allow for future concessions often times prevents them from receiving an offer.
Inventory
We spend a great deal of time at One South following the inventory in the marketplace.
Inventory levels matter. The chart above shows the number of homes available relative to the number of homes being absorbed. Inventory is measured in time (months) and effectively states that if no new homes were to come to the market, how long would we have, given the current rate of absorption, before we ran out of homes to buy.
In economic terms, buyers collectively act rationally. Acting ‘rationally’ means they will be attracted to the best value available in any given marketplace. The more options there are relative to the number of buyers in the market, the less power any individual seller has. Often times, sellers tend to look to the past to price their home and pay little to no attention to current market conditions (we wrote an entire post on this exact topic here…) and almost always ignore the impact of seasonality. Taking into account inventory makes for far better pricing (and negotiating) decisions.
Market Activity
One of my personal favorite metrics to track is the number of pending sales. When a home is placed under contract, it is considered to be in ‘Pending’ status in MLS. The rate of new pending inventory in a strong indicator of market activity.
The chart below includes the rate of closed sales as well as new pending sales. As you can tell, the pending sales tend to occur anywhere from 45 – 60 days prior to closed sales.
Most national statistics track closed sales and in doing so, deliver reports on market conditions that lag the actual market conditions. When we hear government sponsored statistics discussing market health, it can be misleading as the activity being reported is generally 3 – 4 months old. Keeping an eye on the pending inventory will give you a far better picture of where your market stands currently.
Conclusion
We touched on a few of the easier but still insightful statistics. But with just a little thought and some basic knowledge of how to download data, some amazing observations can be made. We have helped our clients price some truly special properties and accurately predict buyer behaviors that would not be evident without some in-depth analysis.
MLS can help you find:
- How much more buyers are willing to pay for a new home
- How much less buyers are willing to pay for homes with clapboard siding than vinyl
- How much of a discount or premium the market expects for different streets in the Fan
- The impact of non-warrantable condo associations on values
Challenge your agent to deliver you real insight, not just ‘comps.’ MLS is a wonderful database and asking it the correct questions will yield some great intel.
 Selling and Buying at the Same Time


