• Skip to primary navigation
  • Skip to main content
  • Skip to primary sidebar

Sarah Jarvis Team at One South Realty

at One South Realty

  • Search MLS
  • Stats
  • Deals!
  • About Us
    • The Team
    • Testimonial
    • 5 Things I Tell My Clients
  • Calling Policy
  • The Blog
  • Show Search
Hide Search

Listing

When Does ‘It’ Start?

January 20, 2016 By Rick Jarvis

Editor’s note – as this article goes to press (January 20), market activity (the RATE of sales) is trending about 15% above last January’s pace per MLS statistics. According to our own anecdotal evidence, we are feeling the same exact thing having already participated in several bidding wars/competing offers and seeing extremely tight inventory conditions. We touched on the likelihood of a robust spring in our 2016 Outlook post.

So the calendar now says January.

SPRING MARKET

The parties are over. The kids are back in school. The scale is your enemy and your New Year’s Resolutions are still taped to the mirror. One of the goals for 2016 is to find a new home and while the spring seems far away when it is 27° outside, May is not as far away as it seems.

When?

So the question everyone always wants to know the answer to is ‘when?’ As in:

  • When does the spring market begin? (sooner than you think)
  • When should we start looking? (now)
  • When do the bidding wars start? (soon)
  • When do we start going to open houses? (now)
  • When do we make contact with an agent? (now)
  • When should I talk to the mortgage people? (now)

Yes, ‘now’ and ‘soon’ are self-serving answers, but also true, and here is why – the best decisions are made when time is ample and surprises are few.

Time Pressure

Making decisions under pressure is no fun. If the spring of 2016 is anything like 2014 and 2015, you will probably be involved in a bidding war to buy the house you want, (or at least the threat of one) especially in the under-supplied markets. If you don’t believe me, ask one of your buddies who bought last March or April and see what they say.

Overpaying for a home or offering terms that are uncomfortable in order to win a bid happens more often when you are in a time crunch. When your lease is about to expire or you have to be out of your house in 30 days because it has sold, your options decrease.

Early > Late

So how do you combat time pressure? You guessed it – get started early. Getting started early offers you several distinct advantages.

First and foremost is benefit of market knowledge – knowing what is a good deal, and what is not, comes from paying attention to what sells quickly as well as what doesn’t. Watching the market for a few weeks is not nearly the same as watching it for several months. Along with the benefit of superior knowledge, being able to offer ‘rent-backs,’ flexible closing windows or other ‘bidding war friendly’ terms comes when time is your partner and not your adversary.

And for those sellers, ask yourself this question – how long would it take you to get your home on the market if you found the perfect place to buy? If your answer is measured in weeks, then you are probably going to miss that perfect opportunity.

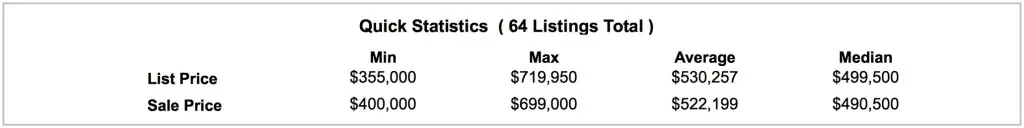
The Numbers Tell the Story …

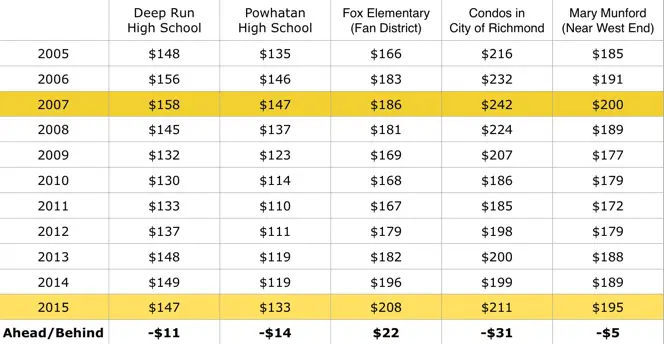
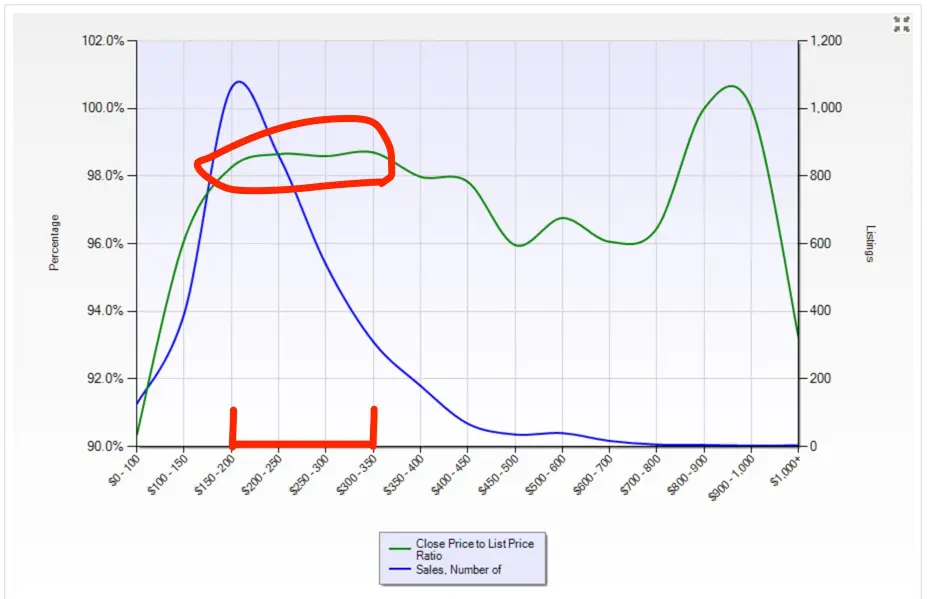
Take a look at the chart below that show the number of NEW PENDING sales (it measures the time when houses go under contract):

Look at the rate of increase from December to May each year – the rate of sales basically increases by 100%. Not 20% … not 50% … ONE HUNDRED PERCENT INCREASE!

Time On Your Side

So as you can see, once the calendar turns to 1/1/16, the real estate world starts to change and things begin to accelerate … and accelerate rapidly. And while you may not be ready to move just yet, getting started early allows you take your time, watch the market and get your financial ducks in a row. Give yourself time to make the best decision possible and on your optimal schedule.

So does it mean you have to buy a home on January 1?  No. It means you need to get started early and begin to do the things that put you in the best position to win when the opportunity presents itself … even if the perfect time isn’t until March, April or May.

Getting started 5 minutes too early is far better than getting started 5 minutes too late. Buying a home can be pressure-filled under the best of circumstances, so don’t make it harder on yourself by making time your enemy.

The Ultimate Guide to Valuing Your Property

October 5, 2015 By Rick Jarvis

In our continuing ‘Ultimate Guide’ series, this post will tackle one of the most important aspects of real estate, that of correctly valuing properties.

Now, I have a good friend who is an agent in the Outer Banks of North Carolina who sells some very nice properties along the Atlantic Ocean and Pamlico Sound.  Whenever he is asked how much a great view is worth, his standard response is ‘whatever someone will pay for it.’  While the statement sounds a bit trite, it is incredibly true.  In effect, he is quoting the textbook definition of ‘Fair Market Value.’

What is this view worth? Depends on the what the purchaser values.
What is this view of a Corolla sunset worth? Depends on the what the purchaser values.

Here are the topics we will cover:

  • Terminology
  • Determining Market Strength
  • Market Limits
  • Pricing in Accelerating Markets
  • Managing Appraisals in Accelerating Markets
  • Pricing in Decelerating Markets
  • Ratio Pricing
  • Common Pricing Mistakes


With that in mind, here begins the ‘Ultimate Guide to Valuing Your Property.’

The Terms We Use

ValueAll industries have jargon … real estate is no different.
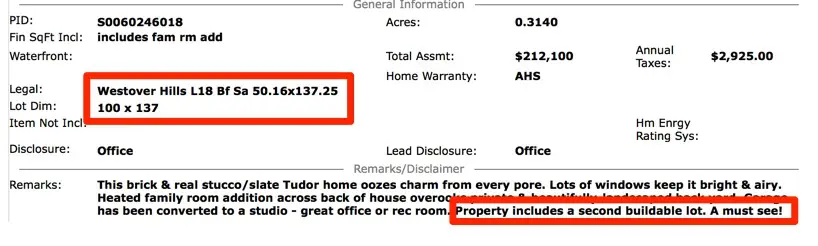
So before we launch into valuations, the first thing we need to do is to take a moment and offer explanations of the terms we will be tossing around in our analysis.  As agents we speak in code and constantly use terms like ‘comps’ or ‘per foot’ or ‘abatement’ and assume that the public has the same understanding as we do. It is unfortunate that we, as Realtors, don’t take enough time to really help those we are working with understand these concepts better.

Below, you will find a brief description of the terms you will see used often in this post.

Multiple Listing Service (MLS)

The Multiple Listing Service (or MLS) is the database that Realtors use.  The MLS contains properties:

  • Currently FOR SALE
  • Currently UNDER CONTRACT (Pending)
  • SOLD
  • Properties that were offered for sale but (for whatever reason) never sold and were removed from the market

The database is extremely comprehensive and it operates in real time. Agents who are a member of the local board are required to place properties into MLS and can face steep fines (or worse) for incorrect use of the system.

It is important to note that Zillow, Trulia, Realtor.com ARE NOT MLS. While they all want to have direct access to MLS data (or more importantly want the public to THINK that they have access to MLS,) they do not. We wrote a piece highlighting the differences here.

Fair Market Value (FMV)

Fair Market Value is the price at which a willing buyer and a willing seller, neither under undue pressure, are willing to exchange an asset. Fair market value is a completely fluid and complex value that has almost an infinite number of inputs. In theory, all of the other measurements we discuss are really just approximations of Fair Market Value.

Listing Price (or Asking Price)

The Listing Price of a property is the official term for the Asking Price or offering price. A price at which a home is formally ‘Listed’ is the price at which the home is offered for sale in MLS.

Pending (Under Contract)

When a buyer and seller agree to the price and terms by which they will transfer the home (also called a ‘Ratified Contract,’) the house is considered to be Under Contract and the property status in the MLS changes from Active to Pending. Once a property has ‘Pended,’ it no longer appears in the feed of available properties.

During the Pending status period, the details of the sale are not public so the price the seller accepted, any other concessions they made or the type of financing used by the purchaser remain unknown. Once the property transfers, the status in MLS changes from ‘Pending’ to ‘Closed’ and the terms by under which the property transferred are recorded in MLS.

Note that appraisers are unable to formally use PENDING properties in their appraisal reports to the lender. Some appraisers will reference a pending property in an appraisal if they feel that they can get a good sense of the expected closing price, but typically they will only use them if there is a lack of comparable recently closed properties.

Closed Price (or Sold Price)

The Closed Price is the price at which the home transfers. In addition to recording the closed price, the MLS also records the additional terms included in the sales price such as seller concessions and type of financing.  Often times, national statistics will reference the Median prices over average prices (see the chart below).  In large data sets, the median and average return different results.  More on Median and Average later in the post.

Note that the closed prices are recorded in the public records at the courthouse and available to most agents (as well as the public) online. The tax records DO NOT reflect seller concessions, nor do they track the other fields in MLS such as commissions, photos, remarks, Days on Market or the agents involved.

Comparable Sales (Comps)

Since the dawn of time, Realtors (and appraisers) were taught, in order to properly value a property, we should examine the three most recent sales of similar condition, features and geography, make adjustments for the features that differ and use some average of these to approximate the market value for the subject property.  These similar sales that we compare the subject property to are called Comparable Sales or Comps.

While the practice is still the primary way that agents value property, access to data has given us all the ability to better qualify the market conditions surrounding the comparable sales. It is unfortunate that few agents use these additional tools to recommend better strategies to their clients.

‘Ask to Close’ Ratio

The Ask/Close ratio is the ratio of the asking price to final closed price. What it is really measuring is the from asking price (listing price) that the seller is willing to accept in order to secure a contract on the property. In Richmond VA (at least in relatively normal markets,) closed prices tend to stay between 2 to 5% of the last asking price. Typically, the quicker the property sold, the higher percentage of listing price the seller received.

The higher the ask/close, the tighter the market conditions (typically.) Conversely, when you see lower ask/close ratios, you are in markets where there are far fewer buyers than there are properties to buy. You can read a more in depth discussion of the use of the ask/close ratio here.

Want to see what an appraisal looks like?

Appraised Value (Appraisal)

The Appraised Value is the value placed the property by an objective/independent 3rd party hired by a lender to pass an opinion on the value. Appraisers largely use the same technique discussed above (comparing the subject property to 3 recent ‘comparable’ sales) to arrive at their value but with a far more defined protocol.

The key takeaway about appraised value is that the appraised amount determines the maximum value the lender will loan against the property (see ‘LTV’ below).

It is also important to note that while appraised value is the most likely of the values to best approximate Fair Market Value, it is still no guarantee that it will.  When markets are accelerating or decelerating quickly, appraisals become far less accurate.  More on determining market conditions below.

Loan to Value (LTV)

The Loan to Value ratio is another way of stating the amount the bank is willing to loan compared to the value of the home. Banks limit their loan amounts based on appraised value or the sales price, whichever is LOWER. A 80% LTV means that the bank will loan a purchaser up to 80% of the appraised value of the home. Generally, the higher the LTV (meaning the more money is loaned against the property relative to its value) the higher the effective interest rate.

www_yesrichmondva_com_sites_default_files_documents_TaxAbatement_FINAL_pdf
The Tax Abatement program’s details can be found here. Please consult the Richmond Assessor’s office for the latest updates.

Assessment

The Assessed Value (Tax Assessment) is the value placed on the property by the local government to determine the amount of real estate taxes due each year. Each locality uses some form of algorithm to place a value on each piece of property within its borders and collects taxes based on the assigned value. The assessment relies heavily on the most recent asles price of a property so the longer the property has gone between transfers, usually the less reflective of actual value the assessment will be.

The City of Richmond also offers a program called Tax Abatement.  When a property’s value is significantly improved, the City of Richmond will forgo taxing the improved value for a period of anywhere from 7 to 15 years.  There are well defined rules that govern what properties qualify and the length and amount of the abatement.

Zestimate (or AVM)

An AVM (Automated Valuation Model) is a computer-based guesstimate of property values offered by several of the online search sites … the most well known is Zillow’s Zestimate.  The AVM’s are created by complex and ever-changing algorithms that take into account any number of factors from comparable sales to tax assessment to supply and demand.

The AVM is a controversial practice in that it’s accuracy is questioned by both the public and Realtors.

Dollar Per Foot

Dollar per Foot or $/SF is the hypothetical value placed on 1 square foot of space in a home.  It is computed by dividing the price of the home by the finished square feet in the home. The $/SF statistic is easily calculable and thus used often but unfortunately, often incorrectly.

We wrote a detailed critique of the $/SF measurement (and its abuse) in this post.

Days on Market (DOM)

Days on Market (or DOM) is a measurement of the amount of time between when the property is offered for sale and when it goes under contract (not when it closes, as is commonly thought.)  The DOM and Ask/Close ratio are strongly correlated as sellers tend to take bigger discounts when the marketing times are long and less when they are short.  DOM is often used as a key indicator of market strength.

We wrote a pretty extensive piece analyzing how to interpret the DOM statistic here.

Absorption/Velocity

The Absorption Rate measures the rate of sales in any given marketplace. Real Estate typically measures absorption in ‘units sold per month.’ So if in all of 2015, 72 homes were sold in the West Broad Village neighborhood, the absorption rate would be 6/month (72 units/12 months = 6 units/month).  The absorption rate is used to calculate inventory (see ‘Inventory’ below) or to look at seasonality (see ‘Seasonality’ below as well.)

The term Velocity is also used to represent a concept akin to absorption. Higher velocity would generally mean a market with a high number of transactions (and the converse would also be true.)

Inventory/Months of Supply

Inventory is a measurement of the amount of homes available in any given market.  Inventory is typically stated in months (as in ‘there is an 8 month supply of homes for sale in the Mechanicsville marketplace.’)  The inventory rate is calculated by dividing the available homes by the absorption rate.  If there are 500 homes for sale in 23113 and the absorption rate is 50 per month, then 23113 would have 10 months of inventory.

Many will argue that 6 months of inventory is a balanced market.  7+ months of inventory will indicate a buyer’s market and anything below 6 months indicates a seller’s market. As one would expect, as the inventory increases, the DOM count typically increases while the Ask/Close ratio tends to fall.

Seasonality

Seasonality is notion that the market performs differently over longer time periods.  While absorption rates are measured monthly, you can get some highly varied answers if you only take a one month snapshot. Looking at fall comps in the spring (or vice versa) might lead you to believe the market conditions are far different than they actually are. Recognizing seasonality is important.

Just know that the real estate market (historically) accelerates into the spring and early summer and the cools in the middle to later summer.  For a limited time in the fall, the market will surge a bit before really snoozing post-Halloween.  Absorption will often ebb and flow by 3 – 4x over the course of a 12 month period.

Rational Behavior

Rational Behavior is the idea that people will act in a manner that is most economically beneficial to themselves. Now, as life has taught us all, people (and by people I mean buyers, sellers, Realtors, builders, appraisers, inspectors, lenders, attorneys, etc.) are not always rational and make what seems like completely irrational decisions.  But in the long run, people tend to behave in a collectively rational way.

Median Versus Average

In many of the statistical packages offered to both the Realtors as well as the public, both Median and Averages are computed.  While most understand what an average is, far fewer understand the significance of the median.

The Median measures the midpoint of the data set and indicates the number at which the same number of records are both above and below. In effect, the median returns a value that is not skewed by statistical outliers.  In smaller data sets, a few highly priced properties can skew the average higher and may paint the incorrect picture to those doing the analysis.

The median and averages in this data set are pretty far apart. Basing a decision on the average might not be the best idea. Might want to redefine the data used int eh analysis.
The median and averages in this data set are pretty far apart. Basing a decision on the average might not be the best idea. Might want to redefine the data used in the analysis.

The best way to use the median is as more of a check to the average. If median and average are significantly different, you have a ‘noisy’ data set. You need to examine the data and see what is causing the divergence.

⇒ Strategy tip ⇒ Make sure to test the average against the median in any analysis.  If the are noticeably different, you may want reconsider making any decisions until you figure out what is causing the difference.

Determining Market Strength

In spring of 2014, we had a home in the Museum district that received 12 contracts. And this was after we priced as high as we thought we could reasonable justify.
In spring of 2014, we had a home in the Museum District that received 12 contracts. And this was after we priced as high as we thought we could reasonably justify … The comps would have NEVER indicated this result.

The first step in valuing any property is to assess the underlying market’s strength. Depending on the market’s direction (up, down or flat) the data you will use to determine price will differ.

As we mentioned above, agents are taught to use Comparable Sales to determine market values.  However, strictly using comparable sales, without context, is not the best strategy strategy. Knowing that a home sold for $525,000 is helpful in pricing analysis, but knowing it had 5 bedrooms, 3.5 baths an oversized 2 car garage and sold in 27 days in October of 2016, with no seller concessions, is a far more valuable piece of information.

Now, if you are involved on a daily basis with the market, you should already have a sense of what is happening. Call volume, e mail volume, web traffic, showing requests, property inquiries and other forms of agent/public communication are anecdotal (but generally accurate) indicators of current market velocity and are perfectly legitimate inputs to the equation … use them.

But for now, back to the graphs – lets look for a moment at the following two zip codes, 23229 (the area near the University of Richmond) and 23838 (Southern Chesterfield).

What do you see over the last 36 months?

Number of Listings

Months of Inventory

Number of New Pendings (Under Contract) Homes

The first thing to note is while the TOTAL number of listings in each market is somewhat similar, the INVENTORY level is far different (remember, inventory is not the number of listings, but the number of listings divided by the absorption rate, measured in terms of months.) This fact becomes even more evident when you compare the number of new pending (houses going under contract) in each zip code. The 23229 rate of absorption is not only higher, it also swells significantly each spring to levels 2 – 3x the rate in 23838, driving the 23229 inventory count down sharply.

So despite a very similar number of homes for sale, sellers looking to value their properties and buyers looking to make offers should treat each each zip code differently.  As is probably pretty obvious by now, these two markets are in far different conditions and the strategy a seller might employ in one would have sub-optimal results in the other.

Even adjacent markets can differ noticeably (23294 and 23060 are both located in Henrico’s West End/Short Pump/Glen Allen region):

Similarly, even price points within the same zip code can differ greatly:

Why show all of these graphs and chats? They are being shown to demonstrate that the market conditions in any region, at any price point and during any season can be radically different. Being cognizant of the market conditions where you are buying or selling is important when adopting a pricing or negotiating strategy.

At the end of the day, the more granular the data, the more powerful the analysis.

⇒ Strategy Tip ⇒ Market conditions are highly localized and assuming that a region’s overall market conditions hold true in all neighborhoods and zip codes is poor strategy.  Even adjacent zip codes can have widely different fundamentals.  Use the available tools to gain a sense of the relative strength of your local market.

Other Indicators of Market Strength 

If the statistics above did not tell a definitive story about your market conditions, there are other indicators can also help understand market strength. By examining both the DOM and Ask/Close ratio, you can also gain insight as to whether or not the market you are in is increasing, decreasing or flat.

See below for two other zip codes (23116 Mechanicsville and 23235 Bon Air):


When you see the DOM statistic fall below 30 days, general speaking, the market is more of a seller’s market than a buyer’s market.  Similarly, if the Ask/Sale ratio is 98% or above, once again, the market is more of a seller’s market than a buyer’s one.  It should be noted, however, that often times if an insufficent number of records are used in the computation, the statistics will have little meaning.  If you are forced to examine a data set with less than 20 or so recored, pay far more attention to the Median DOM than you would the Average.

⇒ Strategy Tip ⇒ In any pricing exercise, understanding the relative strength of the marketplace is critical to sound decision making.  Use market strength indicators to drive what data is used to value property.

Market Limits

As you would imagine, each market has tendencies, strong and weak points and both upper and lower limits. It is hard to find a single family in Richmond with a view of the James River for less than $500,000 and it is almost impossible to sell a home for over $2M unless you are in very specific areas of the region.

Similarly, using the Fan District as an example, selling a $750,000 property at $220/SF for full price in 20 days is far more likely along the 1700 block of Hanover Avenue than it is less than mile away on the 1700 block Floyd Avenue … despite the fact that that both properties share schools, zip codes and MLS zones.

At some point, a market can only bear a certain price before buyers begin to look into other markets. Neighborhoods have highs and lows, as do condo and townhouse projects, zip codes, counties and regions. Often times, sellers over-improve their property or elect to buy a seemingly underpriced luxury home in a non-luxury neighborhood only to suffer the consequences when they go to sell.

How do you find a market’s strongest point?  Look for an intersection and a high number of transactions and a strong ask/sale ratio.

How do you find a marketplace’s limits and avoid this mistake?  You look for spikes in the metrics.

The chart below illustrates the intersection of both sales and DOM in the Eastern Hanover/Mechanicsville area of Richmond.

Matrix

As you can see, the greatest number of sales are occurring (blue line) between $200k and $350k before you begin to see the ask/close (free line) begin to fall.  The market really begins to fall sharply over $450k.

The chart below measures the marketing times for properties in a given marketplace grouped by closed price in the same area.

Matrix

Notice the spike in the DOM statistic when you creek above the $500,000 price.  Obviously, buyers prefer to spend less than $500,000 in this market before they being to look elsewhere.

You can largely see the same message being delivered below:

Matrix

Examining the Ask/Close ratio for the same data set, you begin to see the discount sellers accept to get their homes sold increase noticeably above $350,000.  If you think about this is terms of real numbers, a seller of a $350,000 home should expect to receive just over $340,000 within 40 days while the seller of a $700,000 home would expect to receive roughly $650,000 after 120 days … that is a big difference.

⇒ Strategy Tip ⇒ A buyer should understand the highs and lows within their chosen marketplace.  Look to the DOM and Ask/Close ratio to help understand how the market performs at increasing price points and be cognizant of the probable impact of selling in the future

Pricing in Accelerating and Decelerating Markets

Without a doubt, the past decade has been extremely volatile and hard to predict. When you look at the charts below, you will see how quickly the market went from smoking hot to ice cold back to smoking hot. It really has been a fascinating run.

In extremely short time frames, the market shifted.  From January of 2007 to July of 2009, inventory more than doubled.  And then again, from the summer of 2010 through the fall of 2012, it had been cut in half.  So in a span of 5 years, market conditions changed by factors of 2 – 3x … in opposite directions!  Values, inventory, velocity … all lurched rapidly forward and then snapped quickly back in an incredibly short time frame.  And as the market has continued with its recovery, the spring markets have seemed as robust as the pre-bubble markets of 2004 – 2006.

Accelerating Markets

In markets that are accelerating, especially in a season that is accelerating, comparable sales that would be accurate are all but non-existent.   Stated differently, the comparable sales that indicate values are sharply increasing are either a) yet to happen or b) under contract but yet to close.

What the spring market has felt like recently ...
What the spring market has felt like recently …

Imagine the following fairly common scenario – It is March and the trees are just beginning to bloom.  You own a home in a close-in neighborhood, underpinned by good public schools and close to several private ones, too.  You are convenient to interstate, shopping and entertainment options and you are in a pocket of homes with attractive architecture and where new construction is extremely unlikely (meaning fixed inventory conditions.)  You own a recently renovated brick and slate 1930’s colonial on a manicured lot with a detached two car garage containing art studio/guest suite above it.

All of the most comparable sales are from either last spring (12 months ago) or last fall (6 months ago and in a flat or declining market.)  What to do?

In markets which are accelerating rapidly, we tend to price as follows:

  • Begin with the prior years HIGHEST comparable sales
  • Add in the prior year’s appreciation rate
  • Examine DOM for the homes under contract and use the chart from this article to reasonably predict sales prices
  • Examine the current AVAILABLE properties for guidance and slot the subject property in accordingly

⇒ Strategy tip – in an accelerating market, rely more heavily upon active inventory and pending inventory with low DOM in order to assess pricing levels.  Knowing that more buyers are going to enter the market than there are homes to go around increases the likelihood of competitive offers and escalating bids.

Managing Appraisals in Accelerating Markets

Part of a good agent’s role in any transaction is to anticipate potential issues and be ready with a solution.  There is no more frustrating issue in an accelerating market than when the sales price of the property is above the appraiser’s opinion of value.

Seller: ‘Wait … what?!?  Are you telling me that we got 5 offers, all of which were $500,000 or more … and the appraiser is telling us that the house is worth $490,000?!?’

Agent: ‘Yes.  That is precisely what I am telling you.’

This conversation occurs often … especially in fixed inventory markets during the spring market.

It is the appraiser’s job to report to the bank a value that they reasonably justify for ‘loan to value’ purposes … not to simply agree with your sales price  … the difference is subtle but critical. Despite the common misconception, the contract price for the property and the appraised value are not necessarily one and the same.  In a perfect world they should be, but I think we can all agree, it is far from a perfect world.

An appraiser cannot use sales that are yet to close nor can they use properties currently for sale in their appraisal.  Appraisers are allowed to make some adjustments for ‘market conditions’ but generally speaking, they cannot be too aggressive in giving credit for the excess demand that is yet to be fully documented through higher closing prices.  It is also important to note that just because an appraiser arrives at a value and submits it to the bank, the lender reviews all of the appraisals and is not necessarily required to accept the appraisal if they disagree with the methodology used by the appraiser.  This makes appraisers reticent to push values above what comparable sales dictate, even when bidding wars are common knowledge.

It is an INCREDIBLY frustrating aspect of the mortgage process and it infuriates everyone involved, but remember it is the bank’s money that is being lent (at least in theory) and they can lend it in the ways they see fit.

We discuss with our clients – when a property is offered for sale that is likely to cause a bidding war or is unique in some way that is likely to challenge an appraiser’s valuation, the seller needs to pay special attention to the type of financing potential buyers are using as well as how the appraisal clause in the contract is worded. The more highly leveraged the buyer, more likely the susceptible the buyer is to an appraisal issue. If a buyer does not have the cash reserves available to make up the difference between the sales price and the appraised value, they may no longer qualify for the purchase of the property. The danger is obvious – a deal moving towards closing that can no longer close means starting over again. If the seller has made plans contingent upon their home closing … movers, painters, contractors, contracts, commissions, etc … and all of a sudden their sale is not going to close on time (or at all!) … well you get the picture.  And if contract is released and the property needs to be put back to the market, will the same demand exist? Will a bidding war occur again?  What if interest rates have changed? What if the other competitive buyers have purchased something else? What if there are another 5 homes on the market now?

⇒ Strategy Tip ⇒ In a rapidly accelerating market, the seller holds the risk if they are counting on a buyer with a loan that is highly sensitive to appraised value.  Make sure your plan contains a contingency reserve for a missed appraisal and/or mitigate risk with specific appraisal language. Ask your agent what language can be inserted into a contract to shift the risk back to the buyer.

Decelerating Markets

Hopefully, a market in steep decline is still decades away. While self-proclimaed market soothsayers are always quick to scream ‘bubble’ or ‘crash’ anytime we have periods of high growth, the likelihood of another major market adjustment is fairly remote.

The last period of rapid adjustment (downward) occurred beginning in late 2007 and continued through 2011 (with the majority of the adjustment occurring between 2009 through 2011.)  The primary reason this adjustment was so profoundly painful for so many was the incredible speed at which it dropped. A 30% adjustment in asset values in a two year period is a very jarring adjustment and it proved financially fatal to many.

While the causes are numerous and complex, the simplest reason for the rapid expansion (and subsequent collapse) was criminally negligent access to credit followed by equally idiotic denial. The expansive credit policies that lead to the creation of the housing bubble were immediately followed by credit so strict it effectively prohibited willing buyers to enter the market and blunt the fall. Now that we have returned to more reasonable credit policies more in line with 1995 – 2000, we should stay away from the violent swings of the last bubble … at least for the foreseeable future … hopefully??

Regardless, if we once again find ourselves in a declining market, pricing a property becomes far more challenging (than in an accelerating one) and it requires a different set of techniques to accurately assess pricing levels. Since the economic conditions are not ripe for another 30% adjustment, the most likely application of declining market pricing strategies will be when the spring market fades and the less robust late summer market emerges.

See the charts below:

Notice, if you will, the second half of each year. As the spring market peaks in the April/May time frame, the number of homes under contract begins to decline as the year drags on. Imagine bringing a home to the market in the month of June with a need to have it sold by year’s end. What pricing strategy should you use?

In the scenario described above, the key factors to examine are the absorption rate and inventory. Assume that the number of 5 bedroom homes likely to be sold in your marketplace in the next 60 days is historically 7 and there are 20 homes currently for sale, then setting a price to compete with the 7 least expensive competitive homes is the strategy to employ.

What sellers fail to fully grasp is that owning a home (or any asset, for that matter) in a market with declining demand means the asset is actually declining in value the longer you own it. Acting rationally would mean pricing the property to sell now and not 30, 60 or 90 days from now. As a seller, it is human nature to look at the highest comparable sales and use those as the basis for pricing. Unfortunately, the buyers are looking at the lowest comparable sales as a basis for their offers.  Time, unfortunately, is not on your side when selling in a declining market … especially when you are against a deadline.

⇒ Strategy tip – in a decelerating market, the value of the underlying asset is declining each and every day. Selling quickly by pricing at or near the bottom of the pricing band means achieving as much from the sale as economically possible.

Ratio Pricing

One of my favorite techniques to use when challenged by a unique property is to use a technique I call ‘Ratio Pricing.’  I am sure that there is a far more technical name for the practice, but for now, I am going to stick with mine as it describes exactly the technique that is being used.

Ratio Pricing is used to extract market premiums for features or conditions that may not be easily identifiable in the data.  Infill is one such example where Ratio Pricing is helpful as is pricing certain streets or neighborhoods that may not behave in the same way the surrounding market.

The Citizen 6 Example – When faced with pricing the infill project along Floyd Avenue called Citizen 6, we were faced with the question of how to price a property for which there were literally no comparable sales.  What did we do?

  • Look for examples of new infill in other mature areas and extract the premium for the new homes – Going back several years, we were able to find examples of infill in established mature areas and compare the $/SF to the surrounding older properties at the time.  Several upscale homes along Grove Avenue in the Museum District were built in the middle 2000′ that traded roughly 15% above market.
  • Identify the value of 2 off street parking spaces – We were able to compare pricing of homes with off street parking to those without and found that the discount is anywhere from $10,000 to 20,000, depending on the block.
  • Identify the value of true contemporary architecture – We were able to identify some rare occasions of true modern architecture sold at market and were able to see a 3 to 7% premium in those sales.
  • Establish a base price per foot for the Fan District – At the time we were looking at the data, the Fan District was trading at roughly $190-205/SF for renovated properties.  When we grossed up the Fan $/SF by the premiums, we landed in the mid $250’s per square foot.  After looking at neighborhood highs and lows, we decided on sizing the properties such that they would not exceed $700,000.

At the time we were looking at the data (Summer of 2013,) the Fan District was trading at roughly $190-205/SF for renovated properties.  When we grossed up the Fan $/SF by the premiums we extracted, we landed in the middle $250’s per square foot. After looking at neighborhood highs and lows, we decided on sizing the properties such that they would not exceed $700,000.

The result was that we were able to sell all 6 of the infill homes at pricing levels approximately 20% higher than the market (especially along Floyd Avenue) before the homes were even completed. Additionally, we were able to demonstrate to the appraisers assigned to value the property how we arrived at our prices thus experienced no appraisal issues, despite no direct comparable sales.

It was a highly successful project for the developer.

⇒ Strategy tip – Use Ratio Pricing when trying to find premiums for rare situations or required discounts for location, features or some other unique issue. Look for examples in other sub-markets and then apply to the averages in the subject marketplace.

Common Pricing Mistakes

Without a doubt, pricing is part science, part art, part math, part anticipation, part educated guessing, part trial and error and part gut feel. And often times, despite all of the correct reasoning and analysis, you still get it wrong due to a economic shift or changing market preferences.  And lets not forget, that each individual buyer has their own interpretation of fair market value and the features of any individual house may not appeal equally to all prospects.

That said, the most common mistake is some variant of pricing a property too high for the current market conditions. Lets examine the most common reasons why:

Using the Wrong Comps

Garbage in – garbage out, right? The same holds true for the use of comparable sales. If you use the incorrect comps on the way in, the incorrect value will come out.

Choosing comparable sales correctly is critical but often times, both agents and their clients either choose the wrong comps to compare to (Jackson Ward is NOT the same as Church Hill is NOT the same as The Fan is NOT the same as Oregon Hill) in the same way that a brick and slate colonial in Westover Hills is not the same as a brick ranch or tri-level on the same block … in the same way that a Ryan home is not the same as a WB Garrett Home is not the same as Eagle.

All comps are not created equally and failing to recognize the way the market interprets what the property is really being compared to means poor outcomes.

Ignoring Seasonality

We harped on this ad nauseum above, but it bears repeating –  using comps from the fall in the spring (and vice versa), especially in accelerating markets, will not lead you to the correct outcome. Comps are an indication of past conditions and not necessarily the current ones; make sure to apply the rules above to determine the market’s rate of acceleration.

Abusing $/SF

We wrote an entire article about this concept here, but in short, do not use $/SF without making sure that the other homes that you are analyzing are EXTREMELY similar. If the homes are of different ages, materials, lot sizes or have different spaces finished inside (3rd floor/basement) then using $/SF is pointless.

Ignoring Feedback

You can get the comps right, the $/SF right, seasonality right and fully nail the market velocity, but still not sell. Why? Feedback will tell you. The nude sculpture in the foyer, the pet smell, the neighbor with cars on blocks, the lime green family room, the mauve tile in the bath, too much furniture or overall cleanliness can all impact value in a way that is not apparent in the data. Use the feedback to make the adjustments required to get the home sold.

Summary

At the end of the day, pricing can be as complex or as simple as it needs to be. This post was written to help the public understand  the many factors which can impact values. If you can consistently buy assets for less than they are worth, then you are going to advance your financial cause substantially. Conversely, if you fail to recognize the real value of assets, independent of their offering prices, you are going to be set back, especially when the market shifts.

Real estate is a unique investment in that not only is the only asset that you can own that you really use on a daily basis, it is also one of the most financeable. Stocks, bonds or other paper investments don’t keep you dry and offer only marginal leverage. The automobile you just negotiated $500 worth of free undercoating on just dropped by $3,000 when you left the lot. And the autographed rookie card of Mickey Mantle will likely sit in a safe deposit box or a display case in your basement, only to be useful if you decide to sell.

Use the factors above to help guide your decisions.


A Chef, A Greenskeeper and a Realtor Walk into a Bar …

September 14, 2015 By Rick Jarvis

‘Why do we need a Realtor?’

In my early years, I used to get offended by that question. Probably the main reason was that I didn’t really have a good answer. Uhhh … contract … MLS …. Lockbox … you need us!


But as I have aged in this industry, I actually have come to enjoy being asked the question. Why? Because it gives me a chance to educate the clients as to our role and the value we add.

I can cook, but I am no chef…

Sometime in the late 1990’s, as a thank you gift from a client, a personal chef came to our house and cooked a meal for us. It was the first time I met Ellie Basch.

The fig an Prosciutto salad rocks. And her seared tuna is always worth the price of admission.
Ellie’s fig and Prosciutto salad rocks. And her seared tuna is always worth the price of admission.

Now, for those who have ever been on the receiving end of a Jarvis-prepared feast, we are pretty good cooks. I am not saying we are ready to compete on any cooking shows, but you will not feel cheated if you get to eat at Chez Jarvis. My wife’s tenderloin is restaurant quality and I am pretty adept anything grill related. So, as competitive as I am, I could not wait to see if the personal chef (Ellie) was that much better than we were.

Long story short, she was.

Ellie not only made us an absolutely awesome meal (and it was so awesome that we still use her for the One South holiday party some 10+ years later,) it was how she went about making it that was equally impressive. She made it in a stranger’s kitchen, wasted no food, created about 1/10 of the mess we would have and brought it all together at not only the exact same instant, but at the perfect temperature. Lastly, she did what would have taken us several hours and did it 30 minutes, tops.

In all honesty, it was not only fun to watch, it was a great life lesson about being an amateur and being a pro.

You can putt on my lawn, but it won’t be any fun…

I have another good friend who is the superintendent at an upscale golf course. Now, as he will readily admit, growing grass is perhaps the simplest form of agriculture imaginable. Everyone, at some level, can grow grass – seed + water + dirt + waiting – it is not that hard.

Golf, anyone?
Golf, anyone?

But just know this – golf courses, when at their best, are being pushed to their limits of health in order to create conditions most desirable to the golfing community. In key parts of the season, particularly the summer months, it his job to take the grass to the edge without killing it.

So imagine managing 200 acres to its limits each and every day, with multiple types of grasses growing in varied soils, varied shade conditions, highly varied air circulation conditions and varied moisture conditions all while trying to anticipate Virginia’s schizophrenic climate. If the National Weather Service gets it wrong by 5 degrees, especially during the peak summertime, you can kill an entire golf course.

Talk about pressure …

The short version is that my friend is equal parts scientist and artist.  He takes what are an infinite number of variables (nature) and makes sense of them all. He not only has to answer to himself, he answers to those who only see the results but rarely understand the constraints. His work is so good it is considered elite not just here locally, but at a national level.

And you know what else? He makes it look easy.

But real estate is easy …

For anyone who has even been through a real estate transaction, it can appear easy, especially if the agent you are working with is an accomplished pro.  Realize that the biggest part of the reason the transaction is easy is the advice they are providing and the work they are doing that you never see.

Doctors, mechanics, accountants, stylists, PR people, architects, graphic artists … and yes, chefs, golf superintendents and Realtors … we all do things that the public rarely sees and consequently doesn’t fully appreciate.  Yet thanks to HGTV, Zillow, Trulia, Houzz and Pinterest, the myth that real estate is a D-I-Y endeavor is perpetuated.

It is unfortunate because it is just not that easy.

So you can be your own Realtor, but should you?

It didn’t take Ellie 30 minutes to make my meal, it took her 10 years and 30 minutes to make my meal.

It didn’t take my golf buddy a few hours to lay out the protocol for maintaining green speeds on 97 degree days, it took him 15 years and few hours to lay out that protocol.

And guess what else, despite how it sometimes seems, it didn’t take me (or any other Realtor) a few hours to sell your home or find you the perfect home – it took us far longer.

The information and knowledge that we convey to our clients each and every day may seem like we just went to MLS and pushed the ‘meaningful statistic’ button … we didn’t.  Odds are the analysis we did was pulled from the latest market data and created exclusively for you.

While getting a real estate license is relatively easy, becoming a true pro is not. A good pro agent has a feel for values, trends, appraisals, incentives, geography, contract structure, marketing, data, analysis, competition, human nature, staging, design, construction, schools, zoning, finance, rental rates, law and negotiations (and yes, this is an abbreviated list.) We also have to keep up with changes in technology, continuing education, both local and national development and what goes on in Washington, DC.  It is not easy.

When a good agent makes a recommendation, it is based on far more than you can find on one of the thousands of websites dedicate to D-I-Y real estate.

Hire a pro. You will be happy.

Don’t Bring Your Macro to a Micro Fight

September 13, 2015 By Rick Jarvis

microMicro or macro?
Factual or anecdotal?
Data point to trend?
Forest or trees?
Big picture or small picture?

There is an old adage that goes something like this – ‘Don’t bring a knife to a gun fight.’ Personally, I have always tried to avoid fights (especially ones where weapons are involved) so I find that statement particularly easy to abide by. But as it relates to real estate, I often see buyers and sellers using large statistical based arguments to guide individual decisions … or I see them using anecdotal points to try override what large sets of numbers are trying to tell them.

It is unfortunate.

Data Points or Trends?

As agents, we constantly hear – “Well the house down the street sold for $450,000 … ”

I’m sure it did … but how long did it take? Did several sell at that price or just that one? Did they drop the price multiple times or did they get multiple offers? What were the terms? Was there personal property included? Or did the seller include closing costs What was the condition? What season? How many houses were on the market when it did? Who was the builder?

We also hear – “Well the average dollar per square foot in the neighborhood is $165 …”

I’m sure it is … but what houses were included in the analysis? Was the age range set tightly or loosely? How many had a finished 3rd floor … or basement? Or an oversized lot? Or were recently renovated? Same builder? Is the data from the fall or spring? What were the highs and lows?

As you can see, many questions need to be answered in both cases to validate either statistic. Despite the need to fully understand the statistic, many times buyers or sellers (or agents!) grab the one data point out of a sea of analysis that supports their version of the narrative and subsequently base their entire strategy upon it. It rarely works out well.

Micro and Macro Are Different

In its simplest form, MICROeconomics is the study of an individual’s (or entity’s) behavior when resources are limited. This is contrasted with MACROeconomics, where an entire economy is being studied (yes, Econ majors, I know that is a gross oversimplification of Macro and Micro theory, sorry.)

When an individual elects to buy or sell because they feel that the economy is doing well and prices are likely to rise, they are making their decision based on more of a MACRO-economic analysis. If a couple changes their behavior because 3 homes in their neighborhood just sold at record prices, then they are making more of a MICRO-economic decision.

In either case, both micro and macro based decision making is fine, when used to make micro or macro decisions, respectively. However, using macro stats for micro decisions (or vice versa) is not as sound of a practice.

One of the most common mistakes we see is clients taking overall market statistics (MACRO) and trying to apply them to a specific neighborhood (MICRO). Take a look at the chart below – the following graph shows the inventory levels in different segments of the market:

  • Overall Richmond Metro inventory levels (blue line)
  • Southern Chesterfield inventory (purple line)
  • Museum District/Windsor Farms (red line)

As you can tell, the inventory levels in Southern Chesterfield are far higher than both the overall Richmond market and the close-in areas surrounding Carytown.  The MACRO inventory (Richmond Metro) tells a far different story about the market than the MICRO inventory counts in 23838 and 23221.  A client moving from 23832 to 23221 but using a strategy based on 23832 data will not find success.  Similarly, pricing or negotiation strategies based on the entire Richmond region would have drastically different results in either 23838 or 23221. Make sense?

Be wary of bringing your macro analysis to a micro analysis decision (and vice versa …)

Summary

We are all constantly searching for data points to fit our preferred narrative. Sometimes we look down the street at a single comparative sale (out of seven) or sometimes we look to MSNBC, CNNMoney or the Case-Shiller Index for aggregate demand data … both can be equally right (or wrong) depending on the type of decision you are tying to make.

In order to really make the best decisions, know your data. Apply data correctly and you will find your outcomes far better.

Dollar Per Foot, a Critique

July 29, 2015 By Rick Jarvis

‘How much a foot?’
‘What is the per foot on that home?’
‘Feels like a lot per foot!’

‘Dollar per Foot‘ is probably the most used of the comparative statistics in the valuation of housing today. Every buyer references it at some point during the home buying process — as do most sellers. And so do Realtors, architects, appraisers, developers, builders and your local tax assessor.

And while we are all guilty of using $/SF at some point, we need to be extremely careful to make sure we are using it correctly.

Dollar Per Foot is (Unfortunately) the Main Comparison Metric

The name itself suggests that the measurement is the ratio of the price of the home relative to its size.

Stated differently, if you were to buy one square foot of the home, how much would it cost?

Untitled


But it isn’t quite that simple because the $/SF metric does not account for anything other than the FINISHED amount of square feet in the home relative to its price.

$/SF is measures the FINISHED space in the home and views all SF equally, including finished basements and 3rd floors

Do you what factors are not considered to be in the $/SF measurement?

  • garages
  • unfinished basements
  • oversized lots or extra lots
  • water frontage
  • fencing
  • screened porches
  • exterior hardscapes/landscaping
  • other outbuildings
  • roof decks
  • views
  • age of systems
  • poor floor plans
  • beds/baths

Do you know what else $/SF doesn’t adjust for?

  • finished 3rd floors are given the same credit as the first two levels
  • finished basements are give the same credit as the first two levels
  • finished bonus rooms or other finished rooms over garages or outbuildings

So as you can see, the $/SF is a metric with many flaws.

So is $/SF Worthless??

Far from it.

Citizen 6 in the Fan District
Do you think new homes built in decidedly modern aesthetic are accurate indicators of $/SF in Richmond’s Fan District?

$/SF can be a great measurement when the following conditions are met:

  • the homes being compared are similar in age
  • the homes being compared are on similar lot sizes
  • the homes being compared have the same amount of unfinished space
  • the homes being compared have similar materials

When you are comparing two homes in the same neighborhood, with similar characteristics, then using $/SF as a measurement is fine.

However, far too often, the $/SF is used far too broadly and without any consideration for the many factors that can skew the results. I cannot tell you the number of times I have heard a client say that Home A is a better $/SF than House B — and thus a better deal — without making any adjustments for a finished 3rd floor or far better lot.

Some Great $/SF Applications

One the best applications for $/SF is seeking the neighborhood highs and lows.

In every neighborhood, properties will trade in a range where no home’s value rises above or sinks below. Finding these data points can be extremely helpful when trying to establish pricing, especially when pricing unique properties.

MLS provides a function that will allow agents to quickly identify neighborhood value characteristics.

The more narrowly the homes in the data are defined, the more valuable this feature becomes in establishing the limits for the values. Agents familiar with this feature will be able to help a buyer or seller understand where the subject property fits into the range of values.

Using $/SF as a Time Machine

In case you missed the memo, 2008 – 2012 was a rough stretch.

Almost every market was impacted — equities, banking, real estate, manufacturing, retail — no asset (and no individual) was spared its wrath. The financial crisis was a wholly unpleasant adjustment in values and real estate arguably led the way.

As we continue to put that ugly period further in the rear view mirror, many who made purchase decisions at or near the apex (2006/7) wonder if the 20-30% loss has recovered enough to now sell. Using $/SF as a measurement is one of the best ways to tell.

Untitled_3


As you can see from above, a yearly breakdown of $/SF vividly illustrates the relative health of different marketplaces. Using the same geographic data but changing the time periods measured is a fabulous application of $/SF and can lead to some great strategy decisions.

Using $/SF in Reverse

Often times, we recommend to our clients to look for HIGH $/SF to find underpriced housing.

Wait … what??

In certain cases, $/SF values considered higher than the neighborhood averages may indicate that the improvements on a piece of property are low and might be a good spot for an addition or lot split. Having a situation where the value of the land is at or near the value of the improvements often times means opportunity for the shrewd investor.

Many of the close in neighborhoods of the 1920-1940's have many homes with extra lots suitable for building as part of the sale
The remarks in this listing from 2005 references an extra lot.  Note the dimensions in the Legal Description and the actual Lot Dimensions to see that they were combined at some point.

As an example, decades ago, it was a fairly common practice for an owner to purchase the adjacent lot to give their home extra privacy. Over the ensuing decades, these unimproved lots were often merged with the improved ones and simply sold as a package. As pressure to create more housing closer to the city center continues to increase, a growing number of builders are looking for infill lots and will pay a premium for the opportunity to build a home upon them.

Similarly, it is fairly common to see a small ranch or colonial-styled home nestled in amongst larger homes, especially in the neighborhoods of the 1930’s to 1960’s. If market values within the neighborhood exceed the cost of construction by a wide enough margin, these undersized homes present opportunities to add space to the home and create value.

Knowing how to set search parameters in MLS to identify possible opportunities for the contractor/developer/flipper can be of great service to the investment-oriented client. Mastering this application of $/SF will help an agent identify these ‘value-add’ scenarios and create both loyal clients and repetitive income streams.

Condos and $/SF

The Vistas includes TV and phone in the dues. Few projects include this expense.

In case you haven’t noticed, condos tend to trade a higher $/SF than single family homes. Far more often than not, the $/SF for a condo in the city of Richmond is anywhere from $5 to $20 higher than comparable single family.

Likewise, the $/SF for condos can vary wildly not only from project to project, but often times within the same building.

Why is this?

  • Condos compute square footage differently. They generally measure floor space while single family measures from the outside of the walls — thus condo $/SF tend to be higher than single family homes.
  • Condos tend to be more valuable on the upper floors or where the views are best. A condo on the 2nd floor looking at the parking deck should have a different price than a 10th floor condo looking at the River
  • Condo A might include more in the dues than Condo B and thus trade a premium.
  • Larger condo units sometimes include more parking than smaller condos — even in the same building.

So when applying the $/SF measurement to the condo market, you really need to makes sure the external factors influencing values are taken into consideration before any decisions are made.

Summary

Beware of the overuse of the $/SF metric as many sound decisions have been undermined by the misuse of the statistic.

As we continue to speed towards the era where more and more data is more and more available, we need to remember that access and analytics are two different things. The creation of new and complicated statistics is easier than ever before, but it does not necessarily mean they are relevant, accurate or applied correctly.

At the end of the day, the $/SF statistic is one of many and tells only one piece of the overall story. Make sure to understand its application and relevance before you make your decision.

  • « Go to Previous Page
  • Go to page 1
  • Interim pages omitted …
  • Go to page 5
  • Go to page 6
  • Go to page 7
  • Go to page 8
  • Go to page 9
  • Go to page 10
  • Go to Next Page »

Primary Sidebar

804.201.9683


How Do I Schedule a Showing or Find Out More?

I am Kendall C. Kendall, Client Care Coordinator for the team. I am a licensed Realtor and it is my job to answer questions and schedule showings for the properties shown on our sites. Here's our call policy.

kendall@richmondrelocation.net

Working With Buyers

I am Sarah Jarvis, Broker at One South and I work with our buyers. I bring 20+ years of experience to our Buyers Advocacy program and take great pride in helping our clients understand the RVA marketplace.

sarah@richmondrelocation.net

From the Blog

The Making of an American Farmhouse — Walnut Hill, Rockville VA

Periodically, you get smitten with a neighborhood, and Walnut Hill in the Rockville area of Western Hanover County tends to have that effect on people. Walnut Hill is pretty close to what most are envisioning when they imagine a classic neighborhood in a rural setting. With extremely large lot …

[Read More...] about The Making of an American Farmhouse — Walnut Hill, Rockville VA

More Posts from this Category

  • Facebook
  • Instagram
  • LinkedIn
  • Twitter

The Ultimate Stats Page

Ultimate Stats Page

Latest Tweets

  • Just now

Footer 1

Test Text

804.201.9683


How Do I Schedule a Showing?

I am Kendall C. Kendall, Client Care Coordinator for the team. I am a licensed Realtor and it is my job to answer questions and schedule showings for the properties shown on our sites. Here's our call policy.
kendall@richmondrelocation.net

804.305.2344


How Do I Determine What I Can Afford?

We offer competitive mortgage solutions with a commitment to exceed your expectations. We’re local industry experts who are also your friends and neighbors. Whether you want to communicate online or in person, we’re just a call or click away.
www.cfmortgagecorp.com
C&F Logo

Equal Housing

The Sarah Jarvis Team agrees to provide equal professional service without regard to the race, color, religion, sex, handicap, familial status, national origin or sexual orientation of any prospective client, customer, or of the residents of any community. Any request from a home seller, landlord, or buyer to act in a discriminatory manner will not be fulfilled.

IDX Disclaimer

All of the information displayed here is deemed to be gathered from reliable sources but no warranties, either express of implied, are made part of this site. Additionally, the IDX Feed for listing information may contain descriptions of properties not represented by One South Realty, its agents or staff and any violations or misrepresentations are the sole responsibility of the listing brokerage of the subject property in violation.

Contact The Sarah Jarvis Team

804.201.9683

One South Square Logo

2314 West Main Street Richmond, VA 23220

sarah@richmondrelocation.net

Our Call Policy

Accessibility
Copyright

Lending

Southern Trust Mortgage Logo

Chris Lester
Senior Loan Administrator
NMLS# 353830
804-307-7033
Email Southern Trust Mortgage

Our Network of Sites: RichmondVaNewHomes.net, RichmondVaCondos.net, RichmondLuxuryNeighborhoods.com,
RichmondFanRealEstate.net, RichmondVaMLSSearch.net
Housekeeping: Sitemap, Listings Sitemap


Members of the Sarah Jarvis team are licensed in the Commonwealth of Virginia.


Loading Comments...