• Skip to primary navigation
  • Skip to main content
  • Skip to primary sidebar

Sarah Jarvis Team at One South Realty

at One South Realty

  • Search MLS
  • Stats
  • Deals!
  • About Us
    • The Team
    • Testimonial
    • 5 Things I Tell My Clients
  • Calling Policy
  • The Blog
  • Show Search
Hide Search

Blog

iBuying

January 5, 2019 By Rick Jarvis

handshake hello GIF by Laurène Boglio
Our computer would like to purchase your home.

Ever heard of iBuying? If you haven’t, you can say you heard about it here, first, because it is the newest trend in real estate sales and it is on the way to a market near you –– probably.

So what exactly is iBuying? Well, no one definition exists but generally speaking, iBuying is nothing more than a company (or fund) that buys houses from people directly –– at some amount of discount –– for cash, and typically with a quick closing.

iBuying, in effect, replaces the traditional method of an individual owner putting a sign in the yard and selling to an individual purchaser at a market price.

How Does it Work?

2001 a space odyssey GIF
I’m sorry, Dave. I can’t value your home.

In most cases, the owner of a home will go to an iBuyer website, enter information about their home, and wait for the iBuyer to tell them what they would be willing to pay. The iBuyer company will look at its valuation algorithm and make the seller an offer.

Each iBuyer has a slightly different method, but typically, the offer comes with a mandatory site visit from some representative to verify the condition of the property and the features, size, etc. and to make sure that the information given by the seller is accurate.

If everything checks out, the offer can be accepted and closing will occur quickly and for cash.

Yes, it can be that simple.

The Premise (ok, ‘The Catch’)

The catch is this –- the offers come with a discount.

The iBuyer will use an algorithm that establishes likely market value, but then subtracts the cost of commissions, any required repair money, some carrying cost, and a little bit for profit.

But even if the offers are discounted, they are all cash and come with a quick closing.

The thought is that the offer will be close enough to what a typical seller would net on the sale of their home and, thus, the seller take less to avoid the hassle of the selling process –– and to have the certainty of knowing their home is sold.

i want out house GIF by South Park
Sometimes, iBuying makes sense.

In effect, if the seller believes the ‘hassle to discount’ ratio is in their favor, then they should (in theory) accept the offer. If not, then they can sell via the traditional process.

It is a fascinating idea and one that is taking hold in several markets.

The Players

the wave dancing GIF

There are several national players who are attempting to scale this business as we speak –– Zillow Offers being the most notable, but there are others. Knock, OfferPad and OpenDoor are making a lot of noise, while Redfin and a few other brokerages have either launched or are launching their own version of an iBuying program.

And aside from the behemoths mentioned above, local franchised versions also exist –– ’We Buy Ugly Houses’ and Homvestors are forms of iBuying as well, although couched in a more of an opportunistic wrapper. 

Heck, even some local investors (typically tied to a local brokerage) have established funds to do roughly the same thing. 

The Game

Ok, before you go out and rejoice, thinking that you can trick a computer into making you an above-market offer on your 7 bedroom 1 bath Elvis Pressly themed home that is in need of $50,000 of siding and roof repair, that is not how it works. 

graceland GIF

The national iBuyers have what is called a ‘Buy Box’ to determine which properties qualify to be purchased. Typically, the ‘Buy Box’ will only include properties that their algorithms can value with a high degree of confidence –– and shy away from the ones that they cannot. 

iBuyers will also tend to shy away from thin market segments (i.e. luxury housing) where pricing means fewer buyers and longer marketing times.

So the typical Buy Box will include properties that are newer, more homogenous, less expensive, and otherwise easier to peg a value accurately. Properties that are older, historic, have unique features, are expensive, in need of massive repairs, or are otherwise difficult to determine a fair value for will fall outside of the Buy Box and not qualify for an offer. 

So don’t get too excited about an iBuyer coming in and taking your problem property off of your hands at a premium –– they won’t.

Uses and Models

iBuying has applications for sure –– mostly for cases where ‘certainty’ is required or where other factors prevent the home from transferring via conventional means. 

  • If you are a contingent buyer trying to upgrade into a hot market segment, it might make sense to use an iBuyer to sell your home so that you can qualify for the next one
  • If showing your home repeatedly is burdensome, then selling to an iBuyer makes sense
  • If you are in need of selling quickly to take a new job, or move to another market, iBuying might also make sense

But in cases where the seller can wait, or where bidding wars are likely to occur, an iBuyer really isn’t necessary.

The Real Uses

So do you know why Zillow really wants to have an iBuyer platform? And Redfin? And the others?

GIF by The Paley Center for Media

Leads.

A seller inquiring about the value of their home is nothing more than a potential seller raising their hand and identifying themselves as a potential client –– and for any brokerage, that has tremendous value.

So even if the offer is rejected, the lead can still be referred to an agent in the iBuyer network for a referral fee.

Kinda brilliant, isn’t it? You bet it is.

Successful?

The iBuying idea is still rather new and thus, the concepts have not been fully developed and the numbers being reported are not vetted. 

https://www.slideshare.net/MikeDelPrete/phoenix-ibuyer-report-teaser
Phoenix is one of the primary testing grounds for iBuying.

A recent article claimed that iBuying represented as much as 3% of the accepted offers in markets where they were operating, but that is largely a self-reported number (as well as a self-serving one) so it remains to be seen. 

But even if the iBuyer does not buy in a large number of homes, the leads generated are still of great value to the Realtor community. So for iBuying to be successful, it doesn’t have to just monetize the homes they purchase –– it has to monetize the leads it generates.

Richmond and iBuying

The big players aren’t in Richmond in force, but they are somewhat close (Raleigh, NC) and in some parts of Charlotte.

The closest iBuyer markets are in North Carolina, but no markets in the northeast are in operation.

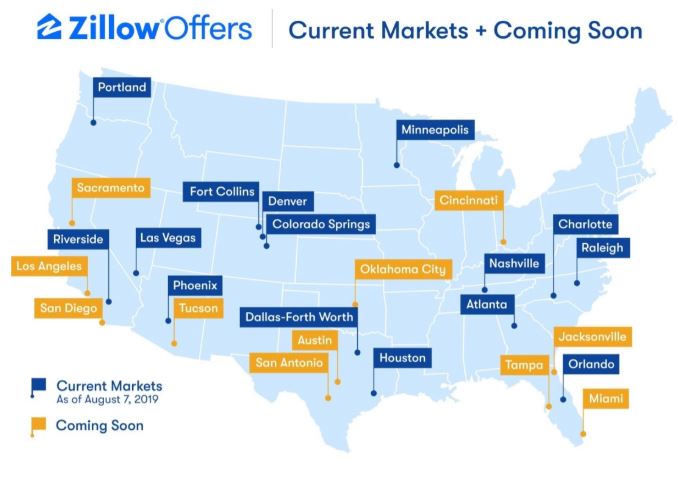
Some locals are playing in the space here locally, but no one of any real scale.

And since Richmond is an old city with aged housing stock, the likelihood that any iBuying platform would identify Richmond as a target-rich market is low. When you look at the map above, you see no iBuyer presence in the older housing markets of the northeast.

But that said, at some point, we will see some version of the iBuying model enter our market. 

Questions Abound

So stay tuned, there are still many questions to be answered.

suspicious thinking GIF by SpongeBob SquarePants
Hmmm …
  • One of the biggest is ‘what will iBuyers do with the homes they buy?’ Some will simply resell them and others will employ a buy and hold strategy. If that happens, will it put even more pressure on inventory?
  • The other question is how will iBuying impact appraisals? If the nearest and most recent comparable sale was an iBuyer sale at a 10% discount, will that impact the value of the surrounding properties?
  • What happens when iBuyers compete with one another? Will the competition between iBuyers squeeze the profits out of the model to such a point that they exit the market?
  • What if an iBuyer ends up with enough inventory that it can act like CarMax and offer trade-in options? Supposedly, that idea is being discussed.
  • Lastly, if and when the market goes through an adjustment, are iBuyers going to be willing to purchase assets that are declining in value? Just ask developers and builders what happened to their balance sheets in 2008 – 2012 and how much fun it was to hold onto housing when it was going down in value by 10% a year for 3 straight years? Hopefully, that adjustment is nowhere near, but most felt that way in the years leading up to the recession, too.

I don’t think anyone has the answers yet.

Summary

The iBuying idea has merit, but there is a lot still to be determined.

That said, the key point is that there is a lot of money backing these firms so the iBuying model is going to be here until someone figures it out.

Like a hammer or a lawnmower, iBuying is nothing more than a tool and it has its specific uses. Learning how to use the tool properly will come with time and practice for all involved.

Having a choice is never a bad thing for the consumer and iBuying will provide the public options that they didn’t have before. 

2019 and the Return to Normalcy

December 30, 2018 By Rick Jarvis

2019 is going to be a transitional year.

In the same way that you might take your foot off of the gas when you see a yellow light in the distance, 2019 will likely be a year where we see some segments of the real estate market lose a bit of their momentum.

‘A Return to Normalcy’ was a phrase used by Warren Harding during his presidential campaign in the 1920’s to define the period of recovery after WWI …

For many, a slower pace will feel extremely odd. All we have known for the past 5+ seasons is rampant price increases and bidding wars. That said, 2019 is likely the year that the frothiest behaviors will subside –– at least in some segments (which we will touch on in a few paragraphs.)

In reality, what we are beginning to see is not a market in decline, but rather <gasp> the leading edge of a normal market.

Disclaimers

First, I need to disclaim a few things.

  • Nothing in this post is guaranteed to happen tomorrow, or probably even the next day –– most of the observations are longer-term in nature and represent a shift in direction, but not a bootlegger’s u-turn.
  • Also, recognize that an individual house value behaves differently than a set (or segment) of houses. Colors, condition, architectural style, yard, appliances –– they all matter to individual buyers and sellers and can impact the value of an individual home. But the behaviors being discussed below refer more to how groups of homes behave in the aggregate.
  • And lastly, any number of unforeseen events could change things –– and fast. Politics, trade wars, real wars, oil prices, and/or natural disasters all have massive impacts on our economy as a whole. And corporate acquisitions, sales, and/or relocations can all have impacts on our region, specifically.

So with that bit of throat clearing, I proudly bring you the ‘What is Going to Happen in 2019’ prediction post (and if you want to see how I did in prior years, you can find 2018’s post here.)

A Return to Comparative Normalcy

What is normal, anyway? Well, we wrote about that very question at the end of 2018. But the takeaway is that ‘what is normal’ is more of a relative question than an absolute one.

via GIPHY

If you asked ‘1993 Rick’ what I thought of a 5% interest rates and 5% appreciation, I would have been giddy with the excitement of how many properties we were about to sell. But when you ask ‘2019 Rick’ the same question, I think, ‘Yeah, 5% rates and 5% appreciation is sure going to be slower than the 4% rates and 10% appreciation of 2016.

The lesson –– it’s all relative.

Does Anyone Remember?

To give you an idea of what a historic version of normal will look like, imagine a market with the following metrics:

  • 6 to 8% mortgage rates (instead of 3.5%)
  • 3 to 4% annual appreciation (instead of 8 to 10%)
  • 45 to 60 day marketing times (instead of 7 to 14 days)
  • 2 to 4% seller discounts (instead of multiple buyers with escalator clauses)

You see, the period from 1990 to 2005 looked a lot different than 2005 to 2018.  

If you asked 1993 me what I thought of a 5% interest rates and 5% appreciation, I would have been giddy with the excitement of how many properties we were about to sell…

And, yes, I get it that many of the inputs are different (demographics, population trends, preferences, architecture, inventory, regulation, materials), but the period of 2005 to 2018 was about as unprecedented as one could imagine.

Honestly, I think a little more stability in housing is a good thing. NASDAQ levels of volatility in housing just isn’t healthy for anyone.

Segments Matter

So in our end of the year meeting at One South, we spent a lot of time on the idea of market segments. Segmenting (stated differently) is nothing more than looking at smaller samples of how connected sales behave, and not aggregating all housing into one analysis.

Pro Tip here –– If you ask an agent, ‘How’s the market?’ and they don’t ask a qualifying statement like ‘Which segment?’ or ‘What area are you referring to?’ then you need to find a new source of your information.

In the same way that New York’s housing market behaves differently than Orlando’s, the new construction market in western Chesterfield should behave differently than Bellevue does –– and this will be key in understanding the new market.

Segments and the Impact of Population

For years, the City of Richmond’s population was in decline. Chesterfield and Henrico were experiencing explosive growth, but the City was not.

Around 2000, the City population trend officially reversed.

In the latter 1990’s, you could feel it starting to happen. VCU was gobbling up properties by the handful and many of the long ignored Downtown neighborhoods began to see construction activity and new businesses popping up.

The population of Henrico and Chesterfield now need to compete with the City for residents and can no longer sustain their growth based on the City’s exodus.

When the 1990’s gave way to the 2000’s, the City’s population began to stabilize at just below 200,000 residents. As we now enter 2019, the population of the City is approaching 230,000, and (by most studies I have seen) is projected to continue to grow.

The Impact of Growth

For the last 5 years, extremely tight City inventory levels and incredibly competitive bidding wars (the worst we saw in 2018 was 18 offers on one house near Carytown, no joke!), especially at the lower price points, has been the norm.

What do you get when your supply is fixed and demand increases? Price appreciation, that’s what.

The growth rate within the City has not only equaled the growth rates of the surrounding counties, but might have actually exceeded them. Any agent who works the more urban markets will tell you that the impact of the growth has been dramatic.

So as long as this trend continues, if you own property in the City, you are probably sitting pretty.

The Behavior of Various Segments

Now when we compare pricing for various segments, what we tend to see is the areas where pricing is the most affordable and closer to the urban core have appreciated the most dramatically. Areas that are further out and/or more highly priced are the ones where pricing has gone up at a slower rate.

Now, with all general statements, there are going to be exceptions, but overall, the statement holds true.  Take a look below at 5-year appreciation rates in different areas of the Metro.

Appreciation_Rates_
These figures only include resale properties, not new ones.

As you can see, the appreciation rate differs greatly.

Does that mean that you have made a mistake or are subject to deflation in the coming years if you live in a suburban area with new construction? Not at all. It just means that you shouldn’t expect that your neighborhood will behave the same as the one with a lower price point or on the other side of town.

And the Reasons, Please?

What do Fox Hall, the Deep Run High School District, and Hallsley all have in common? Fairly high prices to begin with and a great deal of new construction nearby.

What do the Museum District, Bon Air, and Church Hill have in common? Relative affordability and great difficulty in building new homes on any sort of scale.

Simply put, we can’t build houses where we need them most AND we can’t build them at the prices that the market can easily afford.

As we have stated many times before, the ability to provide housing is easiest where land is plentiful. So in areas south and west of Route 288, as well as points east in Henrico, where large tracts of undeveloped land are available, it is far easier to create new communities of scale.

Building is Getting Harder

But as any builder will tell you, not only are they being forced to build further away from the urban core, their costs are skyrocketing (both materials and labor) and the mandates placed on them by the counties are increasingly burdensome.

Take a look at the chart showing what has happened to the cost of construction (labor + materials). The builders aren’t lying when they tell you how much their costs have increased.

Furthermore, the arrival of several national builders is going to change the way new homes are sold in Richmond. DR Horton, Schell Brothers, and Stanley Martin each have the financial backing to build more homes in a quarter than most of the local builders could hope build in a year. The big national builders can gobble up lot inventory, they have their own sales force, and have the capital to build new models for each section of the communities in which they sell.

The Return of Strategic Mortgage Decisions

Let’s shift from home prices to borrowing money.

For the better part of a decade, choosing a mortgage product has been pretty much a no-brainer:

  • What mortgage product do you choose when 30-year fixed rates are at 3.5%? You take the 30-year fixed rate because of the 30-year guarantee.
  • What mortgage product do you choose when 30-year fixed rates are at 4.5%? You take the 30-year fixed rate because of the 30-year guarantee.
  • What mortgage product do you choose when 30-year fixed rates are at 5.0%? You probably still take the 30-year fixed rate because of the 30-year guarantee.

But what happens when 30-year fixed rates are at 6.25% but a 5 year adjustable is at 5% and you only plan on being in your home for 5 to 7 years? The question becomes trickier, doesn’t it?

Welcome to the new (ok, old) world of mortgage finance.

In the 1990’s, we saw clients make the fixed vs adjustable mortgage decision all of the time.

But since rates cracked the 5% floor in 2010, taking the risk of an adjustable mortgage seemed unnecessary.

Where are we currently? We enter into 2019 with rates hovering around the 5% mark. And while no one can claim to be a master of perfectly predicting interest rates, the majority of industry experts feel that 30-year rates between 5.3 and 5.8% (or even as high as 6%) by year’s end are a real likelihood.

So as the spring market emerges and the demand for money increases, the shrewd buyers will keep an eye on the mortgage products OTHER than the 30 year fixed rate mortgage to see how large the spread is.

At some point, the spread between fixed and adjustable mortgages may justify selecting shorter term mortgage products –– especially when the expected hold period is less than 10 years.

Cue the ARM (the Adjustable Rate Mortgage)

Wait, did you just say that ARM’s are good?!? I thought that ARM’s were the thing that caused the financial crisis in 2008?!?

Well, if you don’t underwrite an ARM properly, then yeah, an ARM is not a good product. But no mortgage is safe if it isn’t underwritten correctly –– ARM or otherwise.

So let’s not blame the ARM, let’s blame the true culprit –– shoddy underwriting.

The blue is the percentage of loans underwritten in each year since 2001 that were considered Sub Prime. As you can see, the percentage of Sub Prime is far lower than in the years preceding the crash in 2008.

In the financial crisis of 2008, a great deal of focus of was placed on the Sub Prime mortgage industry. And there was no more abused loan product by the Sub Prime industry than the ARM.

Today’s Arms are Actually Underwritten

The difference today is that the ARMs issued by Fannie Mae, Freddie Mac, and FHA are underwritten properly and also contain caps on the adjustments so that extreme swings in interest rates do not dramatically increase the risk of default. The Sub Prime ARM’s were neither underwritten with any rigor, nor were they capped in such a way as to minimize risk. (And in many cases, they were designed to fail, but that is another topic for another day.)

As an example, a 5/5 adjustable with a 2% cap means a mortgage with a fixed rate for 5 years with a maximum adjustment of 2% at then end of year 5, with another 5 years of the new rate before another adjustment. Is that overly risky? Not when applied correctly it isn’t.

What makes an adjustable mortgage product appealing? The rates tend to be lower –– especially the higher that the 30-year fixed rate becomes.

And while the spread between fixed-rate and adjustable rate products is not quite to levels that justify the switch, it might not be too far off in the future.

So if your loan officer suggests you take a look at an ARM, don’t reject the idea simply out your memory of 2008. An ARM, like a screwdriver or a shovel, is simply a tool. When you use a tool appropriately, they tend to work quite well.

Since 1991

So we (Sarah and Rick) have been in real estate –– as agents, brokers, lenders, developers, owners, and rehabbers –– for longer than we would like to admit. And consequently, we have had front-row season tickets to the booms, several busts, and each subsequent recovery.

We have had front-row season tickets to the booms, several busts, and each subsequent recovery…

What does that mean? It means our advice is based on experience that dates back to the early 1990’s.

  • In 1991, the median sales price of a home in the US was $120,000. It is now $315,600
  • In January of 1991, 30 year mortgage rates were 9.56%. They are now 4.75%
  • In 1991, the average rent was $649. It is now $1,450.
  • In 1991, there was no Zillow and no Trulia. As a matter of a fact, there was not even an online MLS

What else does it mean? It means our team is extremely excited to see times ahead where good decisions will rule the day, and not just momentum.

  • We love the fact that strategic decisions about mortgage are required, and not just blindly electing a 30-year mortgage, regardless of the situation
  • We love the fact that the need to make purchase decisions under multi-offer pressure will likely subside
  • And we love the fact that the data now exists to really help demonstrate the best course of action, and decisions are made based on information, not conjecture

Welcome to 2019, the leading edge of normal.

Frogs Rent

November 28, 2018 By Rick Jarvis

For most homeowners, I think it is going to be difficult to let go of the last few years.

  • ‘Our house appreciated $75,000 in 5 years!’
  • ‘Really? Our house went from $300,000 to 400,000 in 4 years!’
  • ‘Not bad, but ours went from $150,000 to $400,000 in 3 years!’

Unfortunately, we won’t be saying that as often as we used to anymore.

A Return to Normal Appreciation

Being a homeowner, especially a first-time homeowner, has been a lot of fun for the past 5 years. The rate of appreciation has been substantial for most everyone in the post-bubble market. No matter where you live or what you bought, if you signed the closing statement in 2012, you are up anywhere from 20 to 40% in the years since.

But as we approach the end of 2018, we can expect to see future appreciation rates on housing return to the norms of the 1990’s and early 2000’s. And for those who know nothing about the good old days, I am talking about 2 to 4% in any given year (and yes, I realize how boring that sounds.)

That said, imagine if all of this topsy-turvey upsidedown-ness hadn’t happened, or even if prices had fallen over the last five years. Would you have been better off if you hadn’t bought at all?

The answer is simply –– nope.

Why? Because renters always lose in the long run.

Boiling a Frog

There is an old adage about boiling a frog (and no, I have not done this before so don’t call PETA). But it goes like this: If you put a frog in a pot of boiling water, it will immediately hop out. But if you put a frog in a pot of cool water and then put it on the stove, the temperature change is so gradual that the frog will stay in until it is too late.

And for this reason, frogs rent.

If you’re a renter feeling upset because I just compared you to a frog, don’t. For many, renting does make sense. Temporary situations, an uncertain future, recovery from a financial catastrophe, etc –– these reasons all make sense.

But if you are going to be here for a while, are trying to make a smart investment, or are otherwise in a position where you could own but don’t, then you are exhibiting frog-esque characteristics.

Tracking Rents

Zillow, for all of its warts (see what I did there?), has managed to aggregate a lot of really good data and they make it available if you know where to look. And besides tracking housing values (for which they are primarily known), they also track rents.

Take a look at this (use the drop down menu to find RVA, or to look at other markets):

Since 2011, rents in Richmond VA have gone up from an average of $1,179 per month to $1,391 per month. That’s nearly an 18% increase if you are scoring at home. And that chart is for the Richmond region as a whole. Areas such as Shockoe, Manchester, and Scott’s Addition are up by a much larger percentage.

Now, let’s think about the other side of the equation. Do you know how much of your mortgage you would have paid off in the same time period? If you had a 30-year mortgage at 4.5%, you would have paid off anywhere from 10 to 12% of your mortgage in the same time frame.

So even if your home had not grown in value by a single percentage point, owning would mean your payment would have remained the same, your debt would be 10 to 12% lower, and you would have also picked up a nice little tax write-off for the interest you had paid (but please consult your tax advisor to find out how much the Mortgage Interest Deduction would have saved you.)

It doesn’t take a math major to figure out that a fixed payment, lower debt, a nifty tax break, and the potential to eventually not have a house payment once your mortgage is paid off are all pretty good things.

Ribbit.

Elective Renting is a Poor Strategy

The housing market is rapidly putting the finishing touches on its post-bubble recovery and is approaching a time where housing appreciation will revert to the more normal rates of the 1990’s and early 2000’s. The promise of steep appreciation will not be what makes housing the sole reason for ownership as we move into the next decade.

Instead, the reason that housing will be one of the best assets you can own will be related to the reason it has always been a great asset –– its long-term value as a part of your portfolio will dwarf the short-term savings associated with renting.

So don’t fall for the ‘well, I should have bought 5 years ago so I should wait for the next bubble to pop’ logic. You will be far worse off.

Don’t believe me? Ask your landlord.

Getting Out of the Pot in 2019

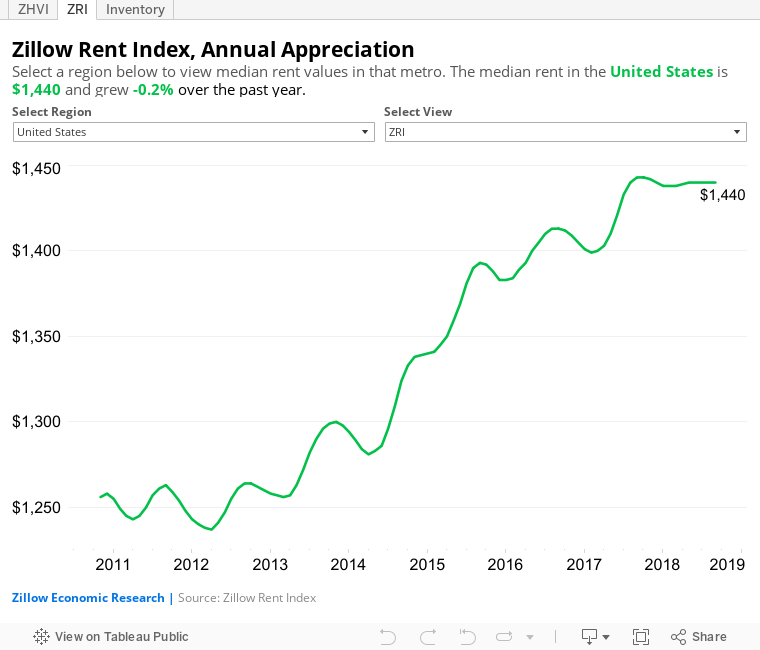
So as 2018 comes to a close, be thinking about the fact that you will soon be getting a note from your management company notifying you of your new water temperature … errrr … rental rate for the coming year. If the landlord does their job right, the increase won’t make you leave –– it will be just enough to make you grumble, but stay.

Interest rates are beginning to edge up after years of staying below trend and house prices are still creeping upwards, too, albeit at a slower pace. Waiting for prices and rates to drop to 2012 levels again is simply not a winning strategy.

Is it getting a bit warm in here? Or is it just me …

The New Normal

October 31, 2018 By Rick Jarvis

The last decade has been anything but normal – especially when it comes to housing.

From 2007 to 2011, property values declined by 30%.
From 2011 to 2013, property values didn’t move very much.
From 2013 to 2018, property values recovered the 30% of the value that they lost, and then added some more.

It has been quite a wild ride.

The Stability of the 1990’s

For my first decade in the real estate business (1993 to 2003), the market was, all things considered, relatively normal. The crash that began in October of 1987 was largely over and the market had settled into a comfortable balance. The housing supply was greater, interest rates were closer to historic norms and mortgage underwriting practices were reasonably responsible.

When Normal Went Away

But sometime around 2003, things began to change. It was barely perceptible at first – just a sense that selling a home seemed easier. Pricing seemed to be inching up a bit more quickly, and homes seemed to sell in less time than in years prior.

By 2005, the change was obvious. Prices were shooting up, mortgage underwriting seemed like an afterthought, and Realtors learned both how to start and how to win a bidding war. And despite bidding wars, appraisals never seemed to come in below the sales prices.

The rest of the story has been told many times before. Prices escalated for two more years, then nosedived, then flatlined, and then shot up again in the same way they did before the whole ordeal began in 2003. The market went from anyone can buy, to massive foreclosure, back to bidding wars — all in a period of about 5 years.

It was unprecedented.

How Old Are You?

Think about this:
If you are in your 40’s or older, ‘normal’ means 7% interest rates and an entire decade where housing values increased a < yawn > rather boring 2 to 4% per year every single year.

If you are under the age of 40, ‘normal’ means 4% mortgage rates and housing values that can move 5 to 10% per year –– in either direction!

It is quite a contrast.

So What is Normal, Anyway?

So which normal is normal? Neither, really.

The future normal will differ from both of the past normals because buyer preferences differ and because government regulations differ.

Our urban cores are rapidly revitalizing and the abandoned properties of yesteryear are being repurposed into vibrant living and working spaces. Suburbia now has competition for the next generation of home buyers.

If you look at the housing stock built in the 1920’s to 1940’s in city neighborhoods, you are seeing appreciation rates literally double (or more) in the past five years. Houses that could be acquired for less than $100,000 in 2013 are now trading for $250,000 or more.

So, for homes that are considered to be ‘close-in’ and ‘affordable,’ the new normal will look more like the more recent version of normal with bidding wars, substantial price appreciation, and continued buyer frustration.

For homes located in the suburbs, especially for newly constructed homes, the picture looks far different. Demand is flattening, especially at the upper price points. Rising interest rates, out of control material costs, and increasing government mandates have all inflated the price of a new home well above the ability of the market to absorb it.

In effect, marketing times, seller discounts, and the supply/demand balance looks a lot more like the 1990’s and early 2000’s than it does the Boom-Bust-Boom sequence of 2008 to 2018.

Summary

Don’t mistake a recovering market for an overly exuberant one. In many ways, we are simply approaching the end of a correction back to trend. Had Wall Street not hijacked the mortgage market and sent us on the roller coaster ride of the last decade, we would be right about where we are today and it would have been a much smoother ride.

But at the same time, don’t lose focus on the new inputs to the housing market, either. The way the next generation feels about our cities is far different than the way the prior generations did. The under 40 crowd only knows Richmond as a city on the rise, with new options for culture, dining, transportation, and entertainment emerging on a daily basis.

So what will the future bring? It isn’t a cop-out to say that ‘it depends.’ What you want to own and where you want to own can yield a radically different experience. Know your market, act accordingly, and don’t assume that all segments are behaving in a similar manner.

Things I Have Been Thinking About

September 26, 2018 By Rick Jarvis

For those of you who follow the blog, you know that most times it is a pretty deep dive into a topic usually related to inventory, pricing, or strategy.

Today’s blog is not one of those. This is a shallower dive on a few different topics that we’re keeping tabs on right now. I hope you enjoy!

Facebook and Fair Housing Laws

Facebook just got nailed for violating Fair Housing Laws.

Yep, good old Facebook can’t seem to get out of its own way lately.

Their ad targeting platforms are so good that they give anyone the ability to include — or exclude — any group based on every imaginable demographic, geographic or psychographic attribute. So if you would like to advertise to everyone except a specific religion, sex, familial status, race, or age, Facebook makes it possible.

The same vehicle that was supposed to connect us all and provide a forum for discourse actually provides really awesome tools to do the exact opposite.

Irony.

Opportunity Zones

Much like Historic Tax Credits were all the rage in the 2000’s, the Federal Government’s new Opportunity Zones have developers and investors extremely excited.

The basic gist of the program is that if you purchase a property in a designated ‘opportunity zone,’ it exempts exposure to the capital gain tax, either partially or wholly, depending on how long you hold it. And while all of the details are not fully fleshed out, it also appears that the opportunity zone program will also make it easier for partnerships who use the 1031 Tax Deferred Exchange technique to break up without penalty.

In layman’s terms, Opportunity Zones provide powerful incentive to free up a ton of capital currently trapped due to tax reasons and deploy the proceeds into areas that need a little push to jumpstart the revitalization momentum. Great idea, right?

In theory, yes.

But what is funny is that they used 2010 Census data to determine where the Opportunity Zones should be. Guess what? Scott’s Addition, with rents now approaching $30/SF, is in an Opportunity Zone.

Yes, there are many needy areas that will benefit greatly from the program. But Scott’s Addition? Really? Whoever was in charge obviously didn’t sign the bill while on the roof of The Hof, while playing shuffleboard at Tang and Biscuit, while drinking a cider at Blue Bee, or having a meeting at Gather, or an IPA at Ardent, or over dinner at Brenner Pass …

Classic.

The 2020 Census

The 2020 census is right around the corner and I think everyone wants to know what the population of the City of Richmond will actually be. We have heard estimates that the growth rate has been anywhere from 2 to 5% per annum, depending on which study you read.

From the 1970’s to the 2000’s, the City’s population was either declining or flat. When your population isn’t growing, the supply of housing, office space, and retail space can remain constant. But when your population begins to grow, you have to start thinking about the impact that has on demand for space.

Fast forward to today and you have roughly 230,000 residents in the City –– which is not as many as the 250,000 residents of 1970, but when you consider that the average number of people per household has dropped by an entire person, we might already have a housing need greater than we did in 1970.

And for a city that has no legal authority to expand, Richmond has to make due with what it has. That can pose a big problem.

Right now, developers are repurposing almost any available property they can find into residential apartment space. And while that has helped provide a solution for the renter, it has shifted the burden to office, retail, and industrial spaces, especially as the business climate has improved. If the Scott’s Addition rental rates are any indicator, the shortage has already begun…

And for anyone who has tried to purchase (not rent) an ‘affordable’ home in Richmond, you know how difficult that has become, too. In the last 5 years, homes priced below $400k in the Fan, Museum District, Jackson Ward and Church Hill have increased by $30/SF and marketing times have been cut by more than half.

Affordability is already wreaking havoc on the residential market, and it seems to be now bleeding into the commercial market as well.

Lastly, A Clean Bill of Economic Health

Last week, a bunch of (arguably) smart people got on a stage in Richmond and said that the economy is strong nationally, as well as regionally.

That makes me feel good because most economists believe that this growth cycle has already surpassed any previous growth cycle in our history.

The fact that we are already in uncharted territory should make everyone nervous, except that it doesn’t. Everything looks pretty solid.

All I can add is that the housing factors that caused the crash in 2008 simply do not exist right now. So if a crash is imminent, it will not come as a result of the housing sector.

So if it all falls apart tomorrow, you can’t blame residential real estate and shady mortgage practices this time!

That’s All, Folks…

So that is it for now.

You may now return to your regularly scheduled programming.

  • « Go to Previous Page
  • Go to page 1
  • Interim pages omitted …
  • Go to page 5
  • Go to page 6
  • Go to page 7
  • Go to page 8
  • Go to page 9
  • Interim pages omitted …
  • Go to page 31
  • Go to Next Page »

Primary Sidebar

804.201.9683


How Do I Schedule a Showing or Find Out More?

I am Kendall C. Kendall, Client Care Coordinator for the team. I am a licensed Realtor and it is my job to answer questions and schedule showings for the properties shown on our sites. Here's our call policy.

kendall@richmondrelocation.net

Working With Buyers

I am Sarah Jarvis, Broker at One South and I work with our buyers. I bring 20+ years of experience to our Buyers Advocacy program and take great pride in helping our clients understand the RVA marketplace.

sarah@richmondrelocation.net

From the Blog

Escalator

The Escalator Clause

The Escalator Clause A quick market update –– As I write this in January, we have already been involved in several multiple bid situations with not just our buyer clients, but with one of our listings, too. So to repeat, it’s January ... of 2019, and the market seems to think it is April ... …

[Read More...] about The Escalator Clause

More Posts from this Category

  • Facebook
  • Instagram
  • LinkedIn
  • Twitter

The Ultimate Stats Page

Ultimate Stats Page

Latest Tweets

  • Just now

Footer 1

Test Text

804.201.9683


How Do I Schedule a Showing?

I am Kendall C. Kendall, Client Care Coordinator for the team. I am a licensed Realtor and it is my job to answer questions and schedule showings for the properties shown on our sites. Here's our call policy.
kendall@richmondrelocation.net

804.305.2344


How Do I Determine What I Can Afford?

We offer competitive mortgage solutions with a commitment to exceed your expectations. We’re local industry experts who are also your friends and neighbors. Whether you want to communicate online or in person, we’re just a call or click away.
www.cfmortgagecorp.com
C&F Logo

Equal Housing

The Sarah Jarvis Team agrees to provide equal professional service without regard to the race, color, religion, sex, handicap, familial status, national origin or sexual orientation of any prospective client, customer, or of the residents of any community. Any request from a home seller, landlord, or buyer to act in a discriminatory manner will not be fulfilled.

IDX Disclaimer

All of the information displayed here is deemed to be gathered from reliable sources but no warranties, either express of implied, are made part of this site. Additionally, the IDX Feed for listing information may contain descriptions of properties not represented by One South Realty, its agents or staff and any violations or misrepresentations are the sole responsibility of the listing brokerage of the subject property in violation.

Contact The Sarah Jarvis Team

804.201.9683

One South Square Logo

2314 West Main Street Richmond, VA 23220

sarah@richmondrelocation.net

Our Call Policy

Accessibility
Copyright

Lending

Southern Trust Mortgage Logo

Chris Lester
Senior Loan Administrator
NMLS# 353830
804-307-7033
Email Southern Trust Mortgage

Our Network of Sites: RichmondVaNewHomes.net, RichmondVaCondos.net, RichmondLuxuryNeighborhoods.com,
RichmondFanRealEstate.net, RichmondVaMLSSearch.net
Housekeeping: Sitemap, Listings Sitemap


Members of the Sarah Jarvis team are licensed in the Commonwealth of Virginia.


Loading Comments...